
By Basem Fawzy
A shopper researches a product online, tries it in a store, orders it that evening and collects it the next day. A week later, they return it to another branch. The shopper sees one retailer. Inside that retailer, the same sequence may appear in several reports owned by different teams.
Store sales, website conversion, pickup performance and returns can all be measured correctly while leaving leadership with an incomplete account of what happened.
A useful starting point for Retail Analytics Consulting is to identify where one team’s results depend on an event recorded by another.
Store sales do not capture every store contribution
If someone tries a product in person and buys it online later, the website records the sale. The store may have helped the customer decide. That contribution is difficult to see when management assesses a branch only through transactions at its tills.
Assess that contribution using evidence such as pickup orders and matched transactions. Anonymous browsing and unrecorded visits will leave some connections uncertain. A nearby online sale alone cannot establish that a store influenced the purchase.
Figure 1 shows why the handoffs matter. Each step creates an opportunity for another team to influence the customer’s next decision.
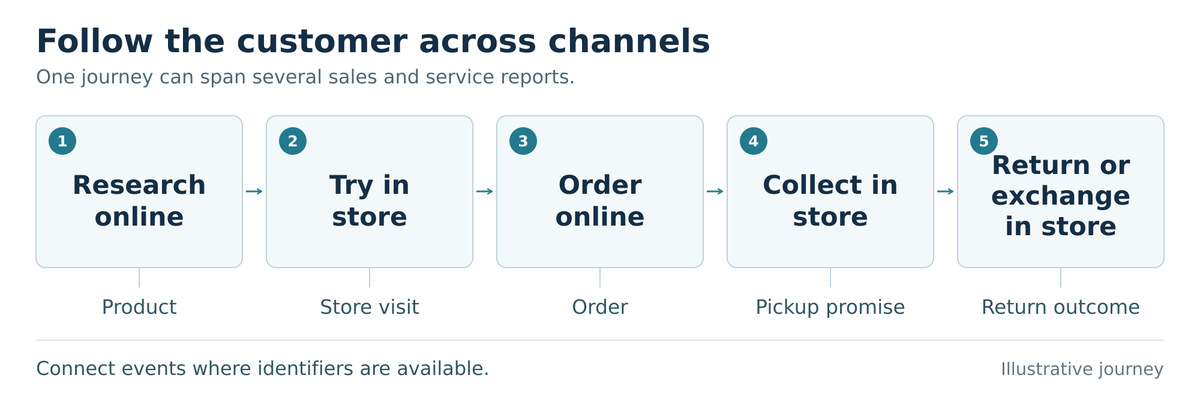
Figure 1. A customer journey can span several teams. Link recorded events where shared identifiers are available.
Returns reveal where the connection breaks
In its 2025 Retail Returns Landscape, NRF estimated that 19.3% of online sales would be returned that year. That forecast illustrates why returns deserve attention beyond the finance report.
An online order returned to a store could end in a refund, exchange or unresolved complaint. The original cause might be inaccurate product information, damage or a late delivery. Recording only the refund value leaves those distinctions hidden.
Without a connection to the original order, the store handling the return can look responsible for a problem that began elsewhere. Linking the purchase, fulfillment and return records gives managers a better basis for investigating the cause. It also helps distinguish a store resolving a customer’s problem from a store creating one.
Review the rate alongside the number of orders, product mix and recorded reasons. A high return rate on a small number of orders calls for a different investigation from a persistent issue affecting a frequently sold product. Separate damaged items from changes of mind before deciding what to fix.
Why are orders delayed, cancelled, or returned?
Start with a problem the team needs to solve. If collection orders are being cancelled, connect the order, stock availability, promised collection time, and cancellation reason. Was the item unavailable, was it not ready when promised, or did the customer change their mind? Each explanation calls for a different response—and an overall cancellation rate cannot tell you which one applies.
For returns, connect the original order line with the return reason, handling location and final outcome. Keep a partial return distinguishable from a complete refund, and an exchange distinguishable from a lost sale.
These links need reliable identifiers. A customer name or an approximate timestamp is not enough on its own. Where records cannot be matched confidently, show the gap instead of treating a guess as a complete journey.
Also preserve what each record represents. One order may contain several items and generate several service contacts. Joining everything into one flat table can repeat the sale and inflate revenue. Use separate measures for orders, items, returns and contacts, connected through appropriate identifiers.
Agree on definitions before comparing locations. One team may record a cancellation when the shopper requests it; another may record it when a refund is processed. Those dates answer different questions. An agreed definition and time period prevent reporting differences from being mistaken for performance differences.
Teams can then keep measures they can act on while management investigates how events in one process affect another.
Build a management view that connects the measures
For a practical illustration of retail reporting, a recent Retail Analytics example from Data Pivot brings sales, margin, inventory and store performance into a Power BI report. Figure 2 shows the demonstration dashboard, which uses synthetic data.
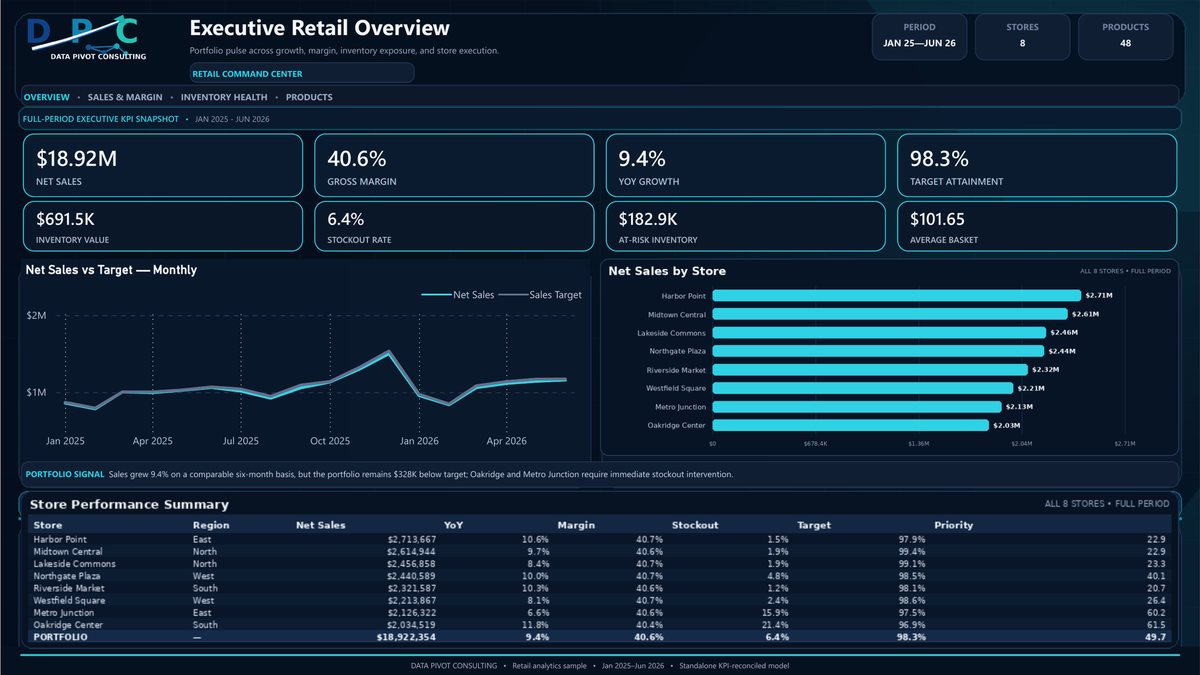
Figure 2. Retail performance dashboard developed by Data Pivot Consulting using synthetic demonstration data, illustrating how sales, inventory, and operational metrics can support management reporting.
Reviewing these measures together helps a manager ask whether sales are rising while availability problems persist in particular stores. For customer experience reporting, extend that approach with linked orders, pickup events and returns, then investigate whether service issues are concentrated in certain products or locations.
A store with repeated collection complaints may need a change to its readiness notifications. Compare when the order was actually ready with when the message was sent before deciding on the remedy. The pattern may point to a communication problem, a picking delay or an inaccurate stock record.
Make the weekly review follow the journey
I would use the weekly review to trace a recurring customer problem through the relevant records. Where did the promise fail? Which event explains the outcome? Who can change the process?
Assign an owner and a measure for the next review. Reporting becomes useful when it helps the retailer fix a handoff the customer experiences, even when that handoff crosses several teams.
Then check whether the change reduced the original problem without moving it elsewhere. Faster pickup completion, for example, needs to be read alongside cancellations and customer contacts if those signals suggest shoppers are still struggling.
About the author
Basem Fawzy is the founder of Data Pivot Consulting. He is a Microsoft Certified Power BI Developer and MBA graduate in E-Business with more than 10 years of experience in business intelligence, data modeling, dashboard development and reporting automation. He has worked with more than 200 clients and regularly translates operational data into management-level reporting frameworks.