

Gasoline fumes, that is. The latest data from Statistics Canada indicate that total Canadian location-based retail sales were up 4.8% year-over-year for the 3 months ending November 2021. That seems respectable at first glance. But this result includes a 32.0% sales increase at gas stations during the period, almost all due to significantly higher pump prices. If gasoline stations are excluded, then retail sales would be up only 2.5%, which is not enough to cover inflation and population growth.
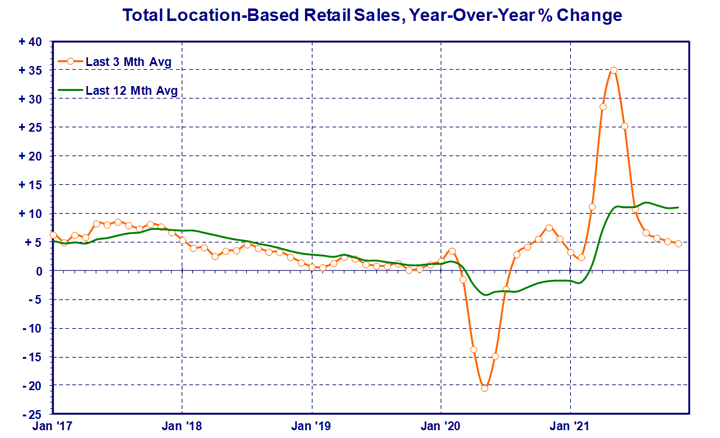
Per the above chart, the underlying 12 month trend (green line) may end the year with a Canadian annual retail sales gain of about 10% in 2021, a recent record. But all of the gain occurred in the first half of the year, and came as a bounce back from the COVID sales depression the year before. Since these numbers are only up to November 2021, the impact of Omicron is still to be factored in.
Food & Drug
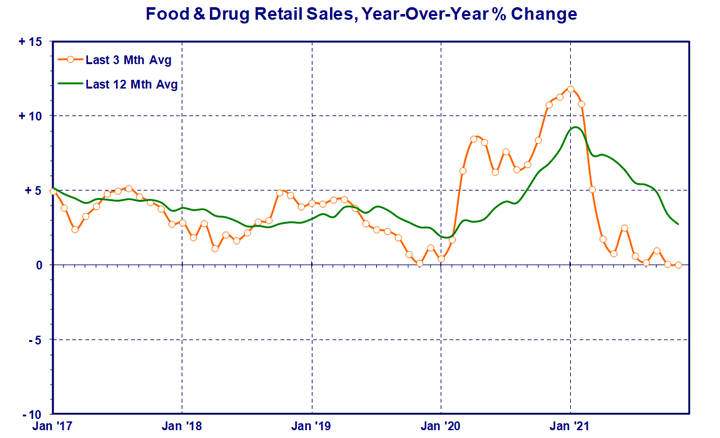
The Food & Drug sector spent most of 2020 heading for the ceiling, and then most of 2021 dropping into the basement. For the 3 months ending November 2021, year-over-year retail sales were up just a sliver at 0.03%, despite high inflation. The underlying 12 month trend has been slowing down all year and forward prospects do not seem promising. Perhaps Omicron will encourage more people to cook and eat at home.
For the 3 months ending November, retail sales at supermarkets & other grocery stores actually declined 0.1% year-over-year, while convenience stores were off by 4.7%. The other large retail type in the sector is Health & personal care stores, but their sales were down too, by 1.2%.
Only beer, wine & liquor stores managed a respectable gain of 4.0%, but this was not enough to offset sales declines in other areas of Food & Drug.
Store Merchandise
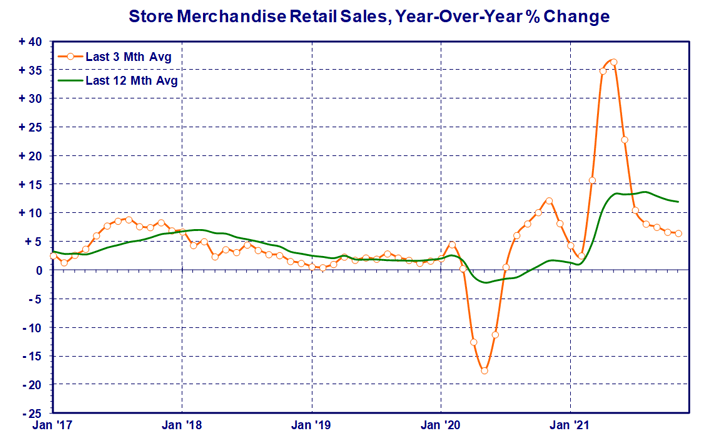
The roller coaster ride in the Store Merchandise sector appears to be slowing down. Nevertheless, retail sales were up 6.5% year-over-year for the 3 months ending November, a good gain by historical standards. At this stage however, both the 3 month and 12 month trends are softening. Given supply constraints and Omicron shopping restrictions, it is difficult to see the situation improving much going forward.
Clothing & clothing accessories was the top performer in the sector, with retail sales up 16.5% year-over-year for the 3 months ending November. General merchandise stores also did well, gaining 8.8%.
Electronics & appliance stores continued to be problem area. Their sales were down 7.0% year-over-year during the period.
Automotive & Related
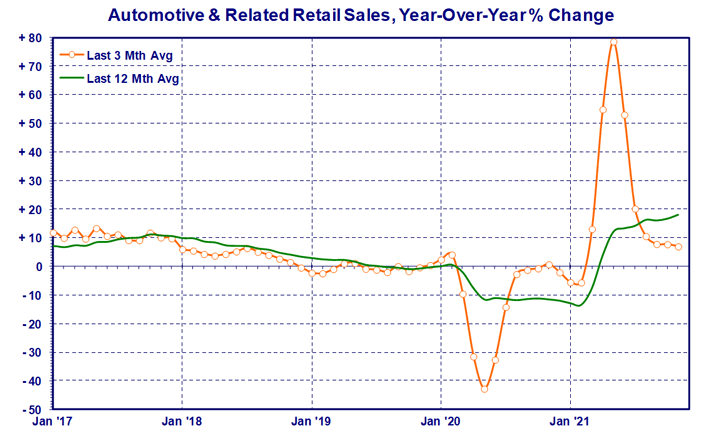
Automotive & Related retail sales increased by 7.0% year-over-year in the 3 months ending November. But this sector has a split personality. Weak motor vehicle sales were more than offset by a huge increase in gasoline station sales.
New car dealers’ retail sales were actually down 1.5% for the 3 months ending November. Some of this may be due to supply issues as strong sales earlier in the year likely reduced inventory levels.
Meanwhile, fuel price increases pumped up gas station retail sales to a huge year-over-year gain of 32.0%. This more or less gets gasoline station retail sales back to pre-pandemic levels.
By The Numbers
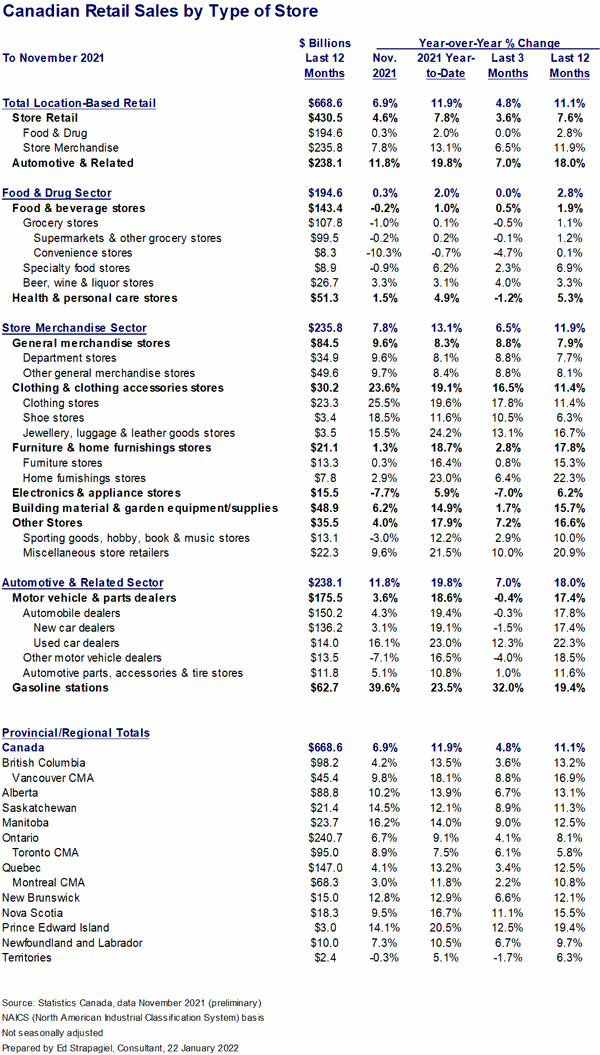
Note that the data and analysis in this report are always based on not seasonally adjusted (or unadjusted) retail sales statistics.
For definitions of store types, see Statistics Canada NAICS.
Canadian E-Commerce Sales
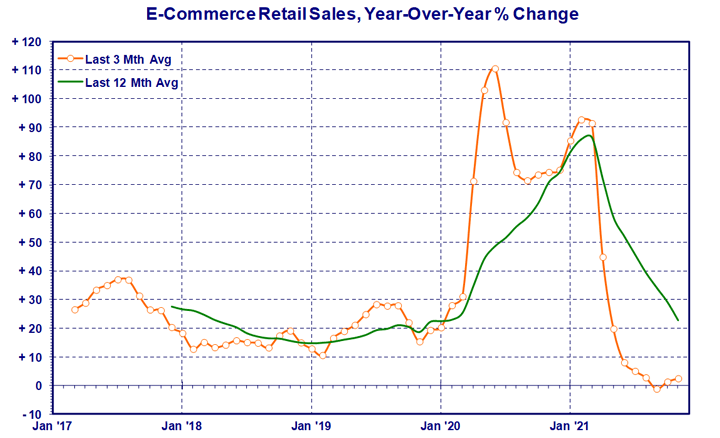
Canadian e-commerce retail sales exploded in 2020 with the arrival of COVID. In recent months however, growth has slowed to a crawl, with a gain of only 2.5% year-over-year for the 3 months ending November. Nevertheless, previous gains still seem to be being maintained. Omicron and another round of bricks and mortar shopping restrictions may encourage consumers to make greater use of e-commerce.
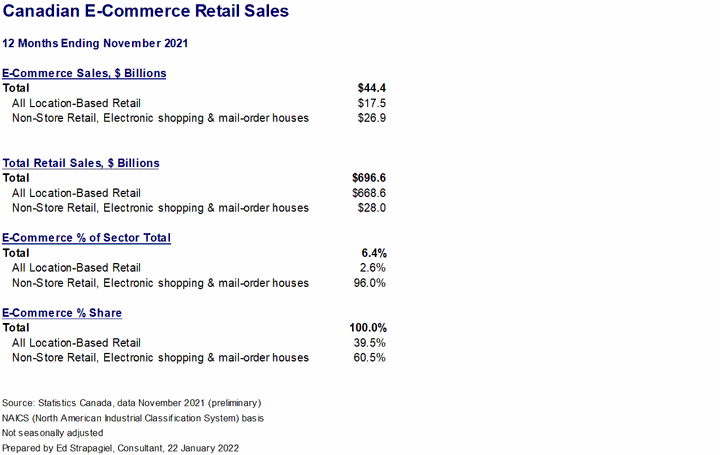
Overall, e-commerce represented about 6.4% of retail sales over the past 12 months, according to Statistics Canada, including both pure plays as well as bricks & clicks stores. Note that Canadian consumers may also buy online from foreign websites which is not captured in these numbers.
Location based retail is the same as that in the preceding “By The Numbers” table. It’s what’s normally reported as Canadian retail sales. Except that it isn’t. Location based retail excludes another section called Non-Store Retailers (NAICS code 454), which includes electronic shopping and mail-order houses, which in turn is where (mostly) pure play e-commerce businesses are. Over the 12 months ending November 2021, electronic shopping and mail-order houses had an estimated $26.9 billion in e-commerce sales.
But that’s not the only source of e-commerce, as (mostly) bricks & mortar location-based retailers also sell online. For the 12 months ending November 2021, this group had an estimated $17.5 billion in e-commerce sales. With electronic shopping and mail-order houses, there’s a grand total of $44.4 billion in e-commerce sales by Canadian operators. Note that this does not include foreign e-commerce purchases made by Canadian consumers, but it does include e-commerce purchases made by foreigners at Canadian operations.
For electronic shopping and mail-order houses, an estimated 96.0% of their sales are currently allocated to e-commerce. For (mostly) bricks & mortar retailers, it can be estimated that 2.6% of their total sales are attributable to e-commerce.
In the final section of the above table, (mostly) pure play operators (namely, under electronic shopping and mail-order houses) generated an estimated 60.5% of all e-commerce sales in Canada, while (mostly) bricks & mortar location-based retailers’ share of e-commerce was 39.5%.
For more explanation on the e-commerce numbers, see Statistics Canada: Retail E-commerce in Canada.
Monthly Update Notification
This analysis is updated monthly as new numbers are published by Statistics Canada. If you would like notification from Linkedin of when an update becomes available (and you’ve read this far), please connect with Ed Strapagiel on LinkedIn.