The total number of insolvencies (bankruptcies and proposals) in Canada increased by 5.7% in June 2026 compared to the previous month. Bankruptcies increased by 3.0% and proposals increased by 6.6%, according to a new report by the Office of the Superintendent of Bankruptcy.
The total number of insolvencies in June 2026 was 11.5% higher than the total number of insolvencies in June 2025. Consumer insolvencies increased by 11.8%, while business insolvencies increased by 5.5%, it said, adding that for the 12‑month period ending June 30, 2026, the total number of insolvencies increased by 5.3% in comparison to the 12‑month period ending June 30, 2025.
“Consumer insolvencies for the 12‑month period ending June 30, 2026, increased by 5.9% in comparison to the 12‑month period ending June 30, 2025. Consumer bankruptcies increased by 8.4%, while consumer proposals increased by 5.2%. The proportion of proposals in consumer insolvencies decreased to 78.3% during the 12‑month period ending June 30, 2026, down from 78.8% during the 12‑month period ending June 30, 2025. For the 12‑month period ending June 30, 2026, consumer insolvency filings accounted for 96.8% of total insolvency filings,” said the report.
“Business insolvencies for the 12‑month period ending June 30, 2026, decreased by 9.7% compared with the 12‑month period ending June 30, 2025. Management of Companies and Enterprises; Accommodation and Food Services; and Mining, Quarrying, and Oil and Gas Extraction registered the largest increases in the number of insolvencies. Retail Trade; Wholesale Trade; and Health Care and Social Assistance registered the largest decreases in the number of insolvencies.”
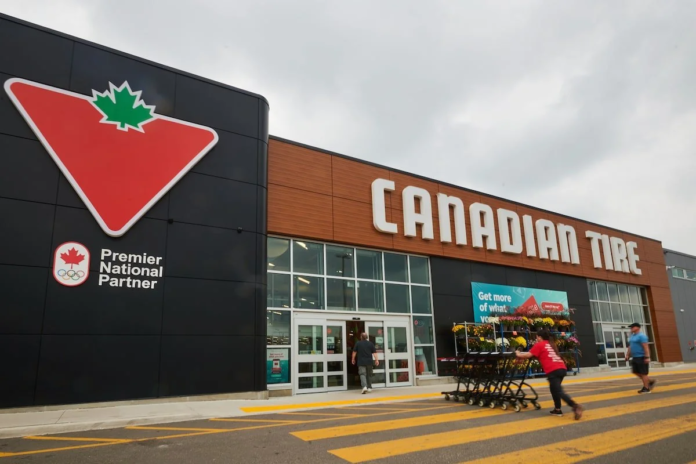
Canadian Tire Corporation, Limited announced Thursday results for its second quarter ended July 4, 2026, showing consolidated comparable sales increased 0.7% in Q2 and 6.3% on a two-year stack basis, led by strong performance at SportChek, where World Cup-related demand contributed to comparable sales growth of 8.0% and 12.4% on a two-year stack basis.
Overall retail sales grew to $5,391.6 million, up 4.5%, compared to the second quarter of 2025.
“In Q2, we demonstrated our operational agility by lowering prices for value-seeking customers, adapting to challenging weather conditions, and ultimately delivering strong financial results,” said Greg Hicks, President and CEO, Canadian Tire Corporation.
“At the same time, we continued to advance our True North strategy, increasing the use of personalized Triangle loyalty offers, growing eCommerce, and delivering strong sales in our new concept Mark’s and SportChek stores.
“The 2026 Men’s World Cup was a highlight of the quarter. Activations in store and online drove soccer fans and new customers to SportChek, and Jumpstart partnered with the Canadian government to announce a multi-year commitment to build 25 inclusive community soccer pitches across Canada by 2029, extending the World Cup legacy in communities nationwide.”
Greg HicksSportChek photo
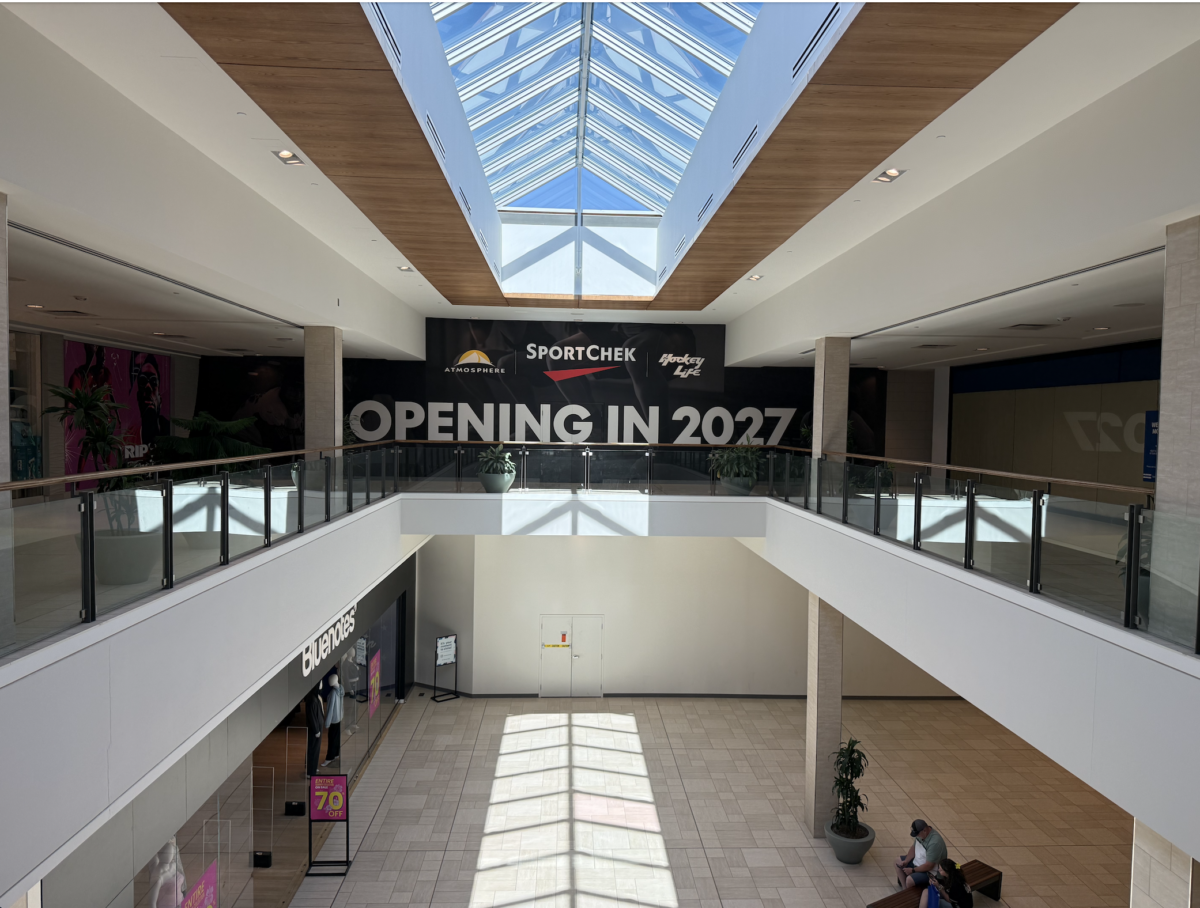
Canadian Tire Corporation, Limited is a group of companies that includes a Retail segment, a Financial Services division and CT REIT. Its retail business is led by Canadian Tire, which was founded in 1922. Party City, PartSource and Gas+ are parts of the Canadian Tire network. The Retail segment also includes Mark’s, SportChek, Sports Experts, Pro Hockey Life, Hockey Experts, and Atmosphere. The company has over 1,600 retail and gasoline outlets.
RETAIL SEGMENT OVERVIEW
Retail sales were $5,391.6 million, up 4.5%, compared to the second quarter of 2025. Retail sales, excluding Petroleum were up 2.5%. Consolidated Comparable sales were up 0.7%.
CTR Retail sales were up 1.4% and Comparable sales were down 0.8% over the same period last year.
SportChek Retail sales increased 7.7% over the same period last year, and Comparable sales were up 8.0%.
Mark’s Retail sales increased 5.1% over the same period last year, and Comparable sales were up 4.2%.
Retail Revenue was $3,890.1 million, an increase of $79.8 million, or 2.1%, compared to the prior year; Retail Revenue excluding Petroleum was down 1.1%.
Retail Gross margin dollars were $1,223.5 million, up 0.7% compared to the second quarter of the prior year, and down 0.1% excluding Petroleum; Retail Gross margin rate, excluding Petroleum, increased 33 bps to 35.1%.
CF Chinook Centre Calgary. Photo by Mario Toneguzzi
In a LinkedIn post, Hicks said: “While a slow start to summer weighed on Canadian Tire, sales at Mark’s and SportChek were strong. And, our True North strategy continued to gain steam: new format stores outperformed on all metrics; our AI platform DaiVID helped us drop more than 5,000 prices for value-focused Canadians; and personalized offers inspired Triangle members.
“We also advanced eCommerce with Q2 enhancements like Canadian Tire’s free ship-to-home for Triangle members. Plus, we introduced tabs that help customers move between our banner sites with one click, offering the full experience and assortment of Canadian Tire, Mark’s, and SportChek in a single visit.
“Working as a retail system, our banners, stores, and sites are in the midst of our first enterprise-wide, AI-informed program that sees us pivot from simply selling products to serving the occasions of our customers’ lives.
“We’re starting with Back-to-School, introducing new products, better displays, and sharper prices – with marketing and loyalty engagement that feel fit for the moment, whether you’re a kindergarten parent or headed off to a dorm.
“This program combines all our generations of customer knowledge with remarkable AI insights from our new MOSaiC platform. Next up is ‘The Holidays’ – an occasion where we’ve always been strong, but we know we can do more, as one enterprise, together.”
Columbia store at Cascade Plaza in Banff, AB. Photo: Cascade Shops
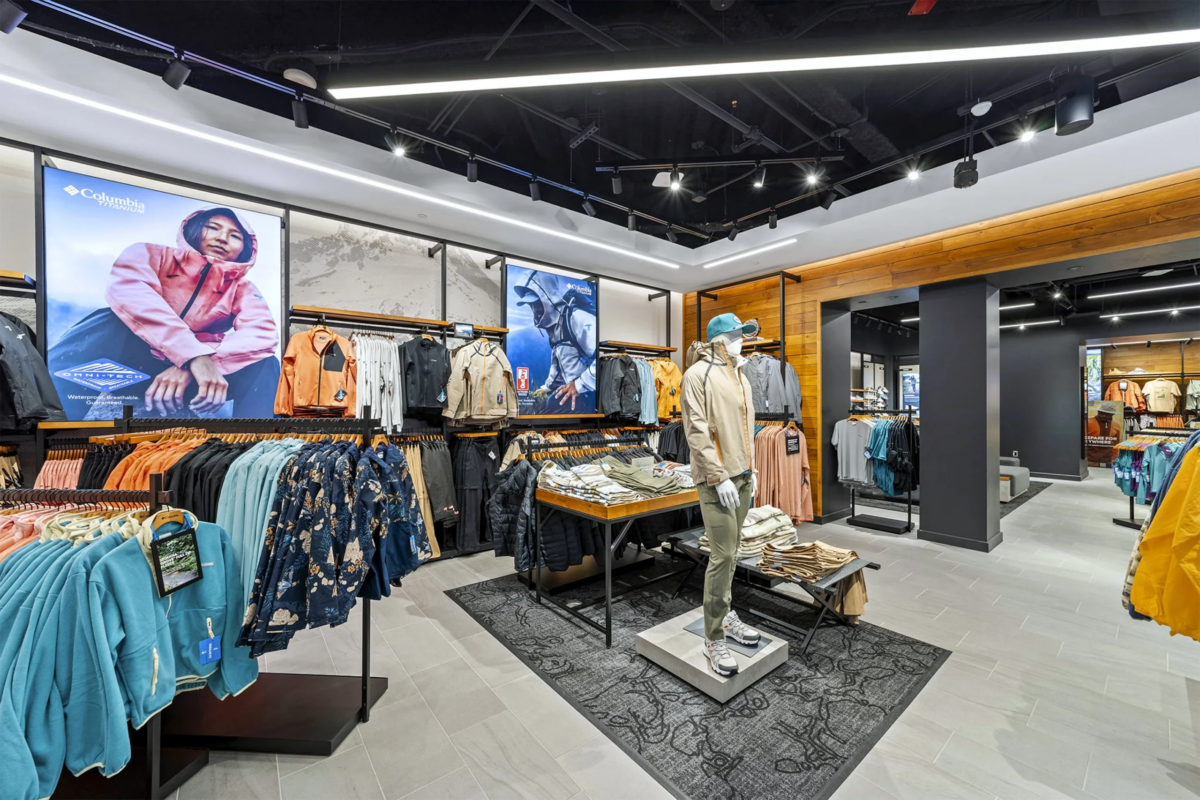
Columbia Sportswear reported a high-single-digit decline in Canadian sales during the second quarter of 2026 as lower wholesale orders and the timing of shipments outweighed growth in the company’s direct-to-consumer business.
The outdoor apparel and footwear company said the Canadian decline primarily reflected lower Spring 2026 wholesale orders and unfavourable shipment timing. Canadian direct-to-consumer sales increased as higher e-commerce revenue outweighed weaker brick-and-mortar performance. Management also pointed to softer store traffic and a more cautious consumer environment.
The quarterly results provide a timely look at the challenges facing an established outdoor brand with a significant Canadian presence. Columbia continues to rely heavily on wholesale distribution in Canada while investing in e-commerce, technical footwear and products intended to strengthen its appeal among younger and more active consumers.
The headline decline also deserves careful interpretation. Wholesale shipment schedules can move revenue between reporting periods, and retailer inventory decisions often influence when sales are recognized before products ultimately reach consumers.
At the same time, Columbia is several years into a broader effort to modernize its flagship brand as consumer expectations continue to evolve across the outdoor apparel and footwear market.
Canada Remains an Important Market
Columbia treats Canada as one of its four reportable geographic segments alongside the United States, Latin America and Asia Pacific, and Europe, the Middle East and Africa.
The company generated approximately US$230.2 million in Canadian sales during 2025, representing nearly seven per cent of its global revenue. Canadian wholesale sales totalled US$141.3 million, while direct-to-consumer sales reached US$88.9 million, leaving wholesale responsible for just over 61 per cent of Columbia’s Canadian business.
Columbia sells apparel, accessories and equipment under the Columbia, Mountain Hardwear and prAna brands in Canada, along with footwear from Columbia and SOREL. The company also reported nearly 400 Canadian wholesale customers and more than 15 company-operated stores at the end of 2025.
That distribution structure makes wholesale particularly important. Columbia’s own stores and digital channels allow it to control merchandising, presentation and customer relationships, but they cannot match the geographic reach provided by hundreds of retail partners across the country.
The wholesale business is also relatively concentrated. Columbia disclosed that its two largest Canadian wholesale customers represented approximately 17 per cent and 13 per cent of total Canadian sales in 2025. Together they accounted for roughly 30 per cent of the company’s Canadian business, although Columbia does not publicly identify those retailers.
That concentration means changes in ordering by one or two large accounts can materially influence quarterly Canadian results.
Shipment Timing Clouds the Picture
The Canadian sales decline should not be viewed simply as a measure of consumer demand. Columbia repeatedly cited shipment timing throughout its earnings discussion. The second quarter of 2025 benefited from earlier wholesale shipments, creating a more difficult comparison this year.
Looking ahead, management expects more than US$30 million in global shipments to shift from the third quarter into the fourth quarter, largely within North America, because of longer logistics lead times and ongoing supply chain disruption.
The company also said it has not experienced meaningful wholesale order cancellations and continues to anticipate growth in North American wholesale sales during the second half of the year, although more of that business is expected to arrive in the fourth quarter.
Columbia Sportswear store at Square One in Mississauga. Photo: Ken Park Architects
A Mixed Canadian Retail Environment
Broader Canadian retail data presents a more nuanced picture than Columbia’s quarterly results alone.
Statistics Canada reported that sales among sporting-goods, hobby, musical-instrument, book and miscellaneous retailers increased 1.8 per cent in May, marking the first monthly gain in three months. Overall retail sales also increased, although volume growth remained modest, reflecting continued pressure from inflation.
SportChek, meanwhile, continued to post positive comparable-store sales earlier in 2026. Parent company Canadian Tire said the chain benefited from strength in athletic footwear, fanwear and hard goods while describing Canadian consumers as resilient but increasingly selective in their spending.
Taken together, the evidence suggests Columbia’s Canadian weakness reflects a combination of shipment timing, wholesale ordering patterns and brand-specific factors rather than a broad contraction in Canada’s sporting-goods sector.
Repositioning a Familiar Outdoor Brand
The quarterly results also arrive as Columbia continues a multi-year effort to modernize its flagship brand. Announced in October 2024, the company’s ACCELERATE strategy is intended to strengthen Columbia’s appeal among younger and more active consumers while preserving the qualities that have made the brand successful for decades.
Management has organized the strategy around five priorities: hiking and trail running, mountain performance, Performance Fishing Gear, outdoor-lifestyle apparel with stronger styling and footwear.
The goal is not to abandon Columbia’s heritage. Instead, the company is working to build greater relevance in a market where consumers increasingly expect outdoor products to combine technical performance with contemporary design and everyday versatility.
Photo: Columbia Sportswear
Footwear Takes Centre Stage
Footwear has become one of Columbia’s most important growth opportunities. The company reported high-single-digit global footwear growth during the quarter, highlighting the Tellurix and Peak Freak hiking franchises, the Konos trail-running line and the Dry Tortuga fishing footwear collection.
Management also said footwear is growing faster than apparel within Columbia’s Spring 2027 wholesale order book and that younger customers have shown encouraging interest in newer and higher-priced products, particularly footwear.
Footwear gives Columbia an opportunity to participate more fully in hiking and trail-running categories while reducing some of its dependence on seasonal outerwear.
The company has not disclosed Canadian footwear performance for the quarter, although footwear generated approximately US$60.5 million in Canadian sales during 2025.
Building on Heritage While Looking Forward
Columbia’s repositioning extends beyond new product launches. Management discussed renewed interest in long-standing products such as the Bahama shirt after investing in stronger storytelling around the collection’s heritage. The company also highlighted continued momentum for its Amaze Puff outerwear line.
Marketing has become an important part of that effort. Columbia pointed to its Expedition Impossible campaign, partnerships with Robert Irwin and expanded outdoor-community events as examples of how it is engaging new audiences while reinforcing the brand’s outdoor credibility.
Although Columbia’s Canadian e-commerce business grew during the quarter, wholesale remains the foundation of its Canadian operations.
The company wants its digital channels to present a stronger expression of the brand while continuing to rely on wholesale partners that provide national reach.
That balance is becoming increasingly important as Columbia introduces more premium products while managing promotional activity, particularly within outlet and brick-and-mortar channels. Management acknowledged that softer traffic contributed to increased discounting during the quarter even as the company works to strengthen its full-price positioning.
Looking Ahead
Columbia’s Spring 2027 wholesale order book provides cautious optimism. Management said approximately 90 per cent of the order book had been completed and was tracking toward low- to mid-single-digit growth, with footwear leading apparel and newer products gaining traction among retail partners. North America is participating in that growth, although Columbia did not provide a separate outlook for Canada.
The company’s Canadian results ultimately illustrate several forces shaping today’s outdoor retail market. Wholesale ordering patterns remain critical, shipment timing continues to influence quarterly comparisons, consumers are spending carefully and established brands are investing heavily to remain relevant in a more competitive landscape.
For Columbia, the next phase will depend on whether technical footwear, updated styling and more focused brand positioning can translate into sustained consumer demand and stronger support from the wholesale partners that continue to anchor its Canadian business.
A new report commissioned by the Canadian American Business Council says a successful renegotiation of the Canada-U.S.-Mexico Agreement could support job growth in both countries, while a breakdown of the trade pact would result in significant job losses relative to the status quo.
The report, Economic Impacts of US-Canada Tariff Escalation Under the USMCA, examines the current state of bilateral trade and the potential economic consequences of three outcomes from the ongoing USMCA review: a successful renegotiation, a breakdown of the agreement and the status quo.
Jobs and economic impact
The report estimates that a successful renegotiation would result in an additional 137,000 American jobs and 98,000 Canadian jobs in 2027 compared with the status quo.
A breakdown of the agreement, by contrast, would be accompanied by 214,000 fewer American jobs and 102,000 fewer Canadian jobs, according to the report.
“Successful renegotiation of USMCA would create an additional 137,000 American jobs and 98,000 Canadian jobs in 2027 relative to the status quo. By contrast, the breakdown of USMCA would be accompanied by 214,000 and 102,000 fewer jobs, respectively,” the report reads.
The report was independently commissioned by the CABC from Oxford Economics and uses quantitative analysis and research to assess the potential effects of the different scenarios.
It says economic integration between Canada and the United States has generated benefits for businesses, workers and consumers in both countries, while manufacturing industries would be the most affected across the scenarios examined.
The report also concludes that tariffs do not ultimately expand the American manufacturing sector or reduce the U.S. trade deficit.
“The US-Canada relationship is one of the most integrated economic partnerships in the world, supporting millions of jobs, driving innovation, and strengthening our collective competitiveness,” said Burke. “This report highlights the extent of integration and how we are stronger together.”
The CABC said the findings come as Canada and the United States navigate the USMCA review and broader bilateral negotiations.
The organization said the report is intended to provide information for policymakers, business leaders and other stakeholders as negotiations continue.
Call for predictability
The CABC said its findings show that tariffs affect both countries and that the degree of economic integration between Canada and the United States makes policy decisions consequential for businesses on both sides of the border.
It said both governments should prioritize collaboration, predictability and policies aimed at supporting shared economic prosperity as negotiations continue.
“The choices made today will determine North America’s economic competitiveness for decades to come,” Burke added. “Businesses on both sides of the border are looking for predictability.”
The CABC said the report is intended to serve as a resource as policymakers, business leaders and other stakeholders consider the future of the bilateral economic relationship.
The council was established in 1987 and describes itself as a non-profit, non-partisan organization focused on dialogue between the public and private sectors in Canada and the United States. It said its members include business leaders and stakeholders from both countries and collectively employ about over 11.6 million people, with annual revenues of close to $6 trillion.
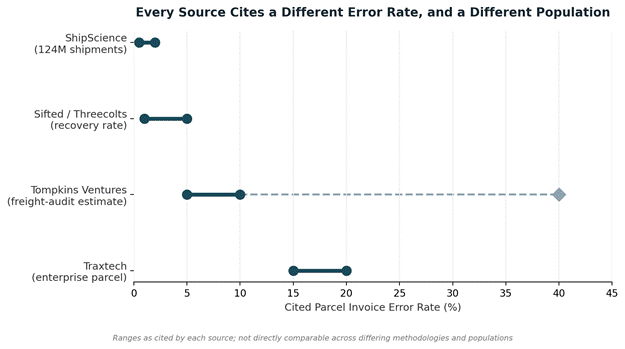
Ask how much carriers overbill shippers and the answer depends entirely on who you ask. One audit firm says 15 to 20%. Another says 2 to 20%. A freight-audit advisory puts it at 5 to 10%, with cases running as high as 40%. A fourth source, auditing over 124 million shipments in Q2 2026, says the “carriers overbill you and you just have to find it” story is largely a pre-2020 narrative that hasn’t caught up to how much more accurate carrier billing systems have become.
All four can’t be measuring the same thing, and they aren’t. The more useful question for a finance or fulfillment leader isn’t which number is right. It’s which categories of discrepancy are structured enough to catch automatically, and which aren’t billing errors at all.
For a retailer shipping tens of thousands of parcels a month, the difference between these framings isn’t academic. Carrier surcharges alone now make up roughly 40% of total parcel spend for the average direct-to-consumer brand, up from about 28% in 2022, and every one of those surcharge line items is a place a rate table, a contract term, or a packaging decision can go wrong. Knowing which of those wrong turns can be caught by a rule, and which one needs a person looking at the shipment, is the actual operating question, well before anyone gets to arguing over which industry benchmark to trust.
Why the Benchmarks Disagree So Much
Same Category, Different Populations
The spread in cited error rates isn’t a sign that nobody knows what they’re talking about. It’s a sign that “error rate” means different things depending on what’s being counted and over what population.
Traxtech’s enterprise parcel audit research puts the figure at 15 to 20% of invoices containing billing errors or recoverable service failures, a number that includes dimensional weight miscalculations, misapplied accessorial fees, duplicate charges, and unapplied contract discounts, counted at the invoice level rather than the dollar level. A separate estimate from a freight-audit advisory firm puts general freight and parcel error rates at 5 to 10%, with the caveat that this is an experience-based industry estimate rather than a measured study, and cases can run as high as 40% in specific shipper profiles.
The Contrarian Data Point Worth Taking Seriously
ShipScience’s Q2 2026 Parcel Refund Index, drawn from over 124 million audited shipments, tells a different story entirely: carrier billing accuracy has improved meaningfully over the last five years, most invoices it audits are now technically correct against the published tariff and contract, and both FedEx and UPS have narrowed their money-back service guarantees since the pandemic to a handful of premium express service levels. As of 2026, FedEx’s Money-Back Guarantee covers only Priority Overnight, Standard Overnight, First Overnight, and 2Day AM, while UPS’s Guaranteed Service Refund covers Next Day Air, Next Day Air Saver, Next Day Air Early, and 2nd Day Air A.M. only. The pool of dollars recoverable from straight carrier billing mistakes is genuinely smaller than the older playbook assumes.
The One Number Every Source Agrees On
None of these sources are wrong. They’re counting different populations against different baselines. What every serious source agrees on, regardless of the headline error rate, is the actual recovery benchmark once an audit runs: most shippers recover somewhere between 1% and 5% of total shipping spend through invoice auditing alone. That’s the number worth anchoring on. A vendor promising recovery well outside that range, in either direction, is a reason to ask harder questions about their methodology before signing anything.
Easiest to Automate: Deterministic, Rule-Based Errors
The categories of error that automate cleanly share one property: checking them is a boolean comparison against structured data, with no judgment call involved.
Duplicate Charges
The simplest case. The same tracking number, the same charge type, billed twice. A system comparing every line item against every other line item catches this with no ambiguity about whether it’s actually an error.
Late-Delivery Guarantee Refunds
Similarly mechanical, though the eligible population has shrunk considerably since the guarantee scope narrowed in the sections above. Checking eligibility is a simple lookup: service level, promised delivery timestamp, actual delivery timestamp. If the shipment falls outside the narrowed guarantee scope, there’s nothing to file regardless of how late it arrived, which is itself worth automating just to stop teams from wasting time disputing shipments that were never eligible.
Unapplied Contract Discounts
Both UPS and FedEx implemented 2026 General Rate Increases averaging 5.9%, with specific lanes seeing 8 to 12%. Billing system configurations frequently lagged behind the new published rates, meaning some shippers were charged at the updated tariff without their negotiated discount applied on top. Comparing the contracted rate schedule against the actual charged rate, line by line, is exactly the kind of check a rules engine handles without any human review.
Misapplied Surcharge Codes
Address correction fees, which can exceed $20 per shipment, residential surcharges, and delivery-area surcharges all have defined trigger conditions in the contract. When the trigger condition wasn’t actually met but the fee was charged anyway, that’s a rule violation a system can flag automatically.
Harder to Automate: Errors That Need Judgment
Some categories look similar on the surface but require more than a lookup table to resolve.
Address Correction Disputes
Address correction fees are the clearest example of this ambiguity. The fee is designed to apply when a shipping label has genuinely incomplete or incorrect address information. But it can also trigger from formatting discrepancies or ZIP code validation mismatches on an address that was actually correct to begin with. Automating the detection of “was this fee charged” is trivial. Automating the determination of “was this fee actually earned” requires comparing the original label data against the carrier’s validation logic, which isn’t always transparent enough to fully automate, and some cases still need a human to review the original shipment record before disputing.
Dimensional Weight Reclassification
A system can flag that a shipment was billed at a higher dimensional weight than expected, but confirming whether the carrier’s measurement was actually wrong, versus the packaging genuinely being that size, often requires the original box dimensions and sometimes photographic evidence. The flag is automatable. The resolution frequently isn’t, at least not without a review step.
Not a Billing Error at All: The Operational Ones
This is the category most audit conversations blur into the “carrier overbilled you” narrative, and it’s worth separating out cleanly because the fix looks completely different.
ShipScience’s data shows 27 to 32% of shipments across a typical network are dimensional-weight impacted, meaning the carrier billed based on dimensional weight rather than actual weight. Only a fraction of those represent a genuine billing error. The larger pattern is packaging choice: an oversized box for a small, light item triggers a legitimate dimensional weight charge under the contract terms as written. The carrier isn’t wrong. The box choice is the problem, and no dispute filing recovers a charge that was correctly applied under the rate table both parties agreed to.
This distinction matters for how a finance or operations team should read their own audit dashboard. A high volume of dimensional-weight-related “flags” isn’t necessarily a sign the audit tool is finding money to recover. It might be a sign that packaging selection needs an operational fix, which is a different project with a different owner than filing carrier disputes.
Conflating the two wastes effort in both directions. A fulfillment team that treats every dimensional-weight flag as a billing dispute to file will spend time contesting charges that are contractually valid and will lose most of those disputes. A team that ignores the flags entirely because “the carrier isn’t technically wrong” misses the actual savings opportunity sitting in front of them, which isn’t a refund at all but a packaging or carton-selection change that prevents the charge from applying on the next shipment.
Manual Review Versus Automated Audit Technology
Why Timing Matters as Much as Accuracy
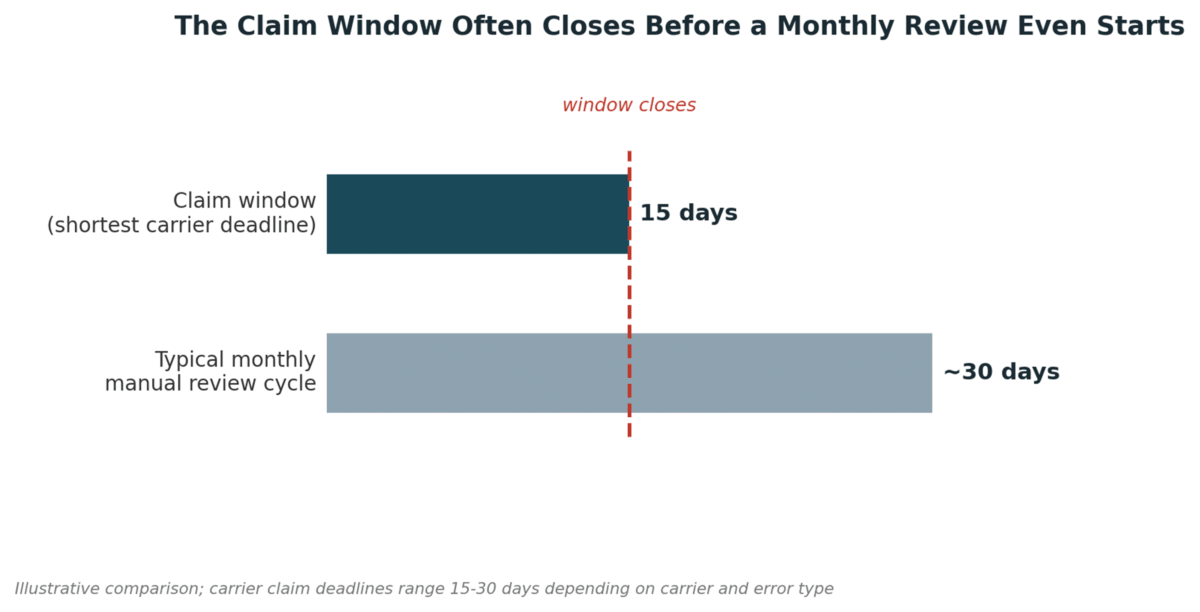
The mechanical categories above share a second property beyond being rule-based: they’re also time-sensitive in a way manual review structurally struggles with. Carrier claim filing deadlines run 15 to 30 days depending on the carrier and error type. A team running a monthly or quarterly manual invoice review is, by definition, checking most shipments after at least one relevant claim window has already closed.
What Continuous Processing Actually Changes
Automated parcel auditing (dash.fi/blog/parcel-audit-software) addresses this by processing invoices continuously as they arrive rather than in scheduled batches, running every line item against the same rule set daily instead of whenever someone gets to it, and flagging the deterministic categories, duplicates, guarantee eligibility, discount application, surcharge triggers, the same day they appear on an invoice rather than weeks later during a periodic review. Continuous processing doesn’t change which errors exist. It changes whether they’re caught inside the window that still allows a claim to be filed.
The categories that need judgment still benefit from automation as a triage layer, even without full automation of the resolution. Flagging a dimensional weight discrepancy or an address correction fee for human review the same day it posts is still faster than a human finding it three weeks into a manual pass through hundreds of invoices, even if a person still makes the final call.
Put a number on it. A retailer processing 40,000 parcels a month generates thousands of invoice line items across surcharges, base rates, and accessorial fees in that same window. A monthly manual review cycle means the earliest a reviewer even looks at week-one shipments is roughly three to four weeks after they shipped, right up against or past the 15-day claim deadline that applies to several of the deterministic categories above. The rule-based errors don’t require more analytical sophistication to catch. They require catching within a window that a monthly cadence structurally cannot hit for a meaningful share of shipments, no matter how good the reviewer is.
What This Means for the Benchmark Conversation
The 15% versus 5% versus “billing has gotten more accurate” disagreement stops being confusing once it’s read through this lens. Sources citing higher error rates are often counting the full population of discrepancies, including the ones that need judgment and the operational dimensional-weight cases that aren’t billing errors at all. Sources citing lower, more conservative recovery rates, in the 1% to 5% range, are typically measuring what actually gets recovered after the deterministic categories are audited and the ambiguous ones are resolved one way or the other.
Neither framing is dishonest. They’re answering different questions. A finance or procurement leader evaluating a parcel audit approach should ask which of these three tiers a given tool or process actually covers, because a solution that only catches the easy, rule-based categories will report a lower recovery rate than a headline benchmark promises, while still doing exactly what it should on the errors that are genuinely worth automating first.
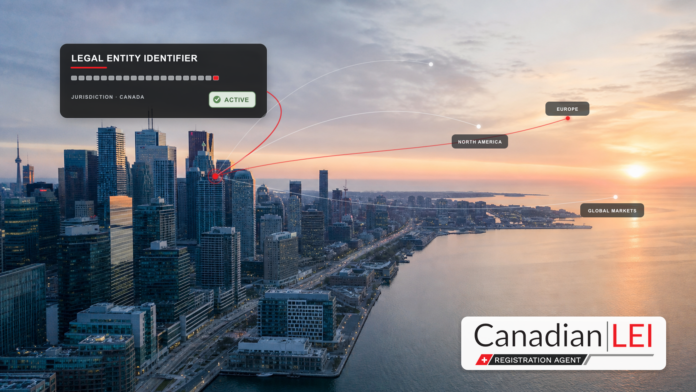
Lead: As banks, dealers, and regulated counterparties rely on standardized legal-entity data, Canadian LEI explains why Canadian companies may encounter LEI requirements in derivatives reporting, securities trading, financial-sector onboarding, and cross-border dealings.
For many Canadian business owners, the first encounter with an LEI code happens at the worst possible moment. A derivative trade cannot be reported, a dealer may require a client identifier before an order can be placed, a bank or investment firm requests additional entity identification, or an international counterparty requires a verified legal-entity identifier before onboarding can continue. Canadian LEI is an LEI registration agent operating in Canada and helps Canadian businesses register, renew, and manage LEIs through the network of GLEIF-accredited LEI issuers; the LEI itself is always issued by an accredited issuer within the Global LEI System. But before getting into the how, it helps to understand the what and the why.
What Is an LEI Code?
LEI stands for Legal Entity Identifier. It is a 20-character alphanumeric code that uniquely identifies a legal entity participating in financial transactions. This may include a company, fund, foundation, trust, non-profit organization, public-sector entity, or another eligible legal entity, depending on the legal and reporting context.
The system was created in the aftermath of the 2008 financial crisis, when regulators discovered that tracking who was on each side of a transaction was surprisingly difficult. Large financial groups, including Lehman Brothers, operated through complex networks of legal entities across multiple jurisdictions, with no consistent identifier connecting them. LEIs were designed to solve exactly that problem.
Today, LEIs are based on the ISO 17442 standard and managed through the Global LEI System, with the Global Legal Entity Identifier Foundation, or GLEIF, responsible for its operational integrity. LEI records are made available through the public Global LEI Index maintained by GLEIF, making the LEI an open and globally recognized standard for legal-entity identification.
Each LEI record contains two layers of information. Level 1 covers who the entity is: its legal name, registered address, jurisdiction, and registration authority details where available. Level 2 provides information on direct and ultimate accounting-consolidation parent relationships, where applicable and reported. It is not a beneficial ownership register and should not be used as a substitute for AML, KYB, sanctions screening, or UBO checks.
Who Needs an LEI in Canada?
Originally, LEI adoption was driven mainly by financial regulation and market reporting. Since then, LEIs have become relevant to a wider group of legal entities because banks, brokers, investors, regulated counterparties, and cross-border partners often rely on standardized entity identifiers. Whether a specific company needs one depends on its activities, counterparties, and reporting obligations: an LEI may be required or requested to complete transactions, onboarding, or regulatory reporting.
In Canada, the clearest use case is OTC derivatives trade reporting. Under the derivatives data reporting rules of the Canadian Securities Administrators (CSA), such as OSC Rule 91-507 in Ontario and Multilateral Instrument 96-101 in most other jurisdictions, counterparties to over-the-counter derivatives are identified by their LEIs in reports submitted to trade repositories. LEI use in this context has been mandatory in Manitoba, Ontario, and Québec since October 31, 2014, and across all other provinces and territories since July 2016. Following CSA amendments that took effect on July 25, 2025, the LEI used for derivatives reporting must also be kept current: the CSA has reminded market participants that a lapsed LEI is not sufficient for compliance.
LEIs also appear in the trading of listed securities. Since July 26, 2021, client identifier requirements now administered by the Canadian Investment Regulatory Organization (CIRO) require dealers to include a client identifier on each order in a listed security sent to a marketplace, and for clients treated as institutional accounts that are eligible for an LEI, that identifier is generally the LEI. Similar requirements have applied to Canadian debt securities transaction reporting since October 18, 2019. As broader context, securities regulation in Canada sits with the provincial and territorial regulators coordinated through the CSA, CIRO oversees investment dealers, and the Office of the Superintendent of Financial Institutions (OSFI) is the prudential regulator of banks and insurers.
Canadian businesses can also encounter LEI requirements when working with foreign counterparties or trading in non-Canadian markets. EU investment firms are generally required to obtain an LEI from legal-entity clients before executing transactions that are reportable under MiFID II/MiFIR, so in practice such a trade may not proceed until the client’s LEI is in place. Similar LEI-based identification applies under EMIR for derivatives reporting in the EU, under SFTR for securities financing transactions, and in US swap data reporting supervised by the CFTC. As local context, CDS Clearing and Depository Services Inc., part of TMX Group, acts as Canada’s central securities depository, and the Toronto Stock Exchange (TSX) is the country’s main listed market.
In Canadian LEI’s experience, Canadian companies most often encounter LEI requests in practical interactions with dealers, banks, investment firms, fund administrators, trading venues, or international financial partners. The need may arise during derivatives reporting, securities trading, investment account onboarding, cross-border financing, regulatory reporting, or when a foreign counterparty needs a standardized identifier for due diligence.
Not every Canadian company needs an LEI today. But the following businesses are more likely to be asked for one.
You may need an LEI if your company:
is a counterparty to over-the-counter derivatives reportable under CSA derivatives data reporting rules, such as OSC Rule 91-507 in Ontario or Multilateral Instrument 96-101 in other jurisdictions;
trades listed securities through a dealer as an institutional account eligible for an LEI, where CIRO client identifier requirements apply;
is a counterparty to transactions in Canadian debt securities subject to LEI-based transaction reporting;
trades shares, bonds, ETFs, or other financial instruments on EU markets or trading venues where MiFID II/MiFIR applies, or enters into transactions reportable under EMIR or SFTR;
is a fund, investment vehicle, or regulated financial entity supervised by a CSA member regulator, CIRO, or OSFI;
is asked to provide an LEI by a bank, financial intermediary, investor, regulator, or foreign counterparty.
If your business sells goods or services locally and does not interact with financial markets, in most cases you may not need an LEI right now. But as banks, brokers, investors, and regulated counterparties often rely on verified entity data, having an LEI in place can sometimes reduce friction later.
Why an LEI Matters Beyond Compliance
It is easy to treat the LEI as another regulatory checkbox. But that view does not fully reflect its practical value.
An LEI gives your organization a verified, globally recognized legal-entity identifier. When a counterparty, investor, or financial institution looks up your code in the GLEIF database, they can see your validated legal reference data maintained within the Global LEI System and, where applicable, parent-relationship information. That kind of transparency can reduce onboarding friction, assist due diligence, and support credibility with counterparties that rely on verified entity data.
For Canadian companies operating across borders or preparing to work with regulated financial institutions, investors, or international counterparties, an LEI provides a standard identifier understood outside Canada. This does not mean that an LEI replaces other checks: banks, brokers, and compliance teams may still need company documents, beneficial ownership information, sanctions screening, and tax details. But the LEI gives them a reliable starting point for identifying the legal entity.
How to Get an LEI
LEIs are issued by GLEIF-accredited LEI issuers, also known as Local Operating Units (LOUs). Registration agents such as Canadian LEI help legal entities access the LEI issuer network and manage the application process. GLEIF notes that legal entities are not limited to an issuer domiciled in their own country, provided the issuer is accredited for the relevant jurisdiction.
The process is straightforward: you submit your company’s registration details, the LEI issuer verifies them against official sources, and the code can usually be issued once verification is complete, depending on the issuer, verification requirements, and completeness of the application. In Canada, company data is commonly checked against official registry filings, such as those maintained by Corporations Canada for federally incorporated companies or the relevant provincial and territorial registries, depending on the legal form and jurisdiction of incorporation.
One thing worth knowing: an LEI must be renewed annually. If renewal is missed, the registration status becomes “Lapsed” in the GLEIF database. A lapsed LEI remains the same identifier, but its reference data is overdue for re-validation. In Canada this matters in particular for derivatives reporting, where the CSA expects the LEI to be kept active, and some other reporting, trading, or onboarding processes may also require the LEI record to be current. A registration agent can track renewal dates and remind clients before their LEI lapses.
Canadian LEI supports LEI registration and renewal for businesses in Canada, issuing 95% of LEI numbers in less than 24 hours, although more complex company structures or additional information requirements may take longer. Canadian businesses can apply for LEI registration or renewal through canadianlei.com.
Winning a listing with a major Canadian grocer is often treated as the finish line, but for many CPG brands it is closer to the starting gun. Retailers grant shelf space based on a promise of consistent supply, and when production cannot keep pace with that promise, the space does not stay reserved for long. Understanding why that gap opens up, and how brands are closing it, matters as much as landing the listing in the first place.
Where Production Actually Falls Behind
A handful of recurring issues tend to explain most production shortfalls:
Forecasting that underestimates real demand once a product gains traction in-store
Co-packer capacity that was never scaled to match retail volume commitments
Raw material or packaging delays that ripple through the entire production schedule
Limited visibility into inventory and production status across multiple facilities
Each of these is manageable in isolation. Together, without a system tracking them in real time, they compound quickly into missed fulfilment windows. According to a recent EY Canada analysis on shifting shelf space strategies, retailers are increasingly turning to smaller, niche CPG suppliers precisely because larger brands have struggled to keep pace with demand for own-brand alternatives.
Shelf Space Is Conditional, Not Permanent
Retailers rarely frame a listing as a permanent arrangement. Most agreements come with expectations around fill rate and on-time delivery, and when a brand repeatedly falls short, buyers reallocate that space to a competitor who can hold it more reliably. A recent industry survey from Turing Labs found that 70 percent of CPG leaders acknowledge competitors reaching shelf first in categories their own brand is actively pursuing, with execution speed cited as the core obstacle rather than a shortage of ideas.
That dynamic puts real pressure on growing brands. A strong product and a good pitch can secure the first order, but sustaining the relationship depends entirely on what happens after the purchase order lands.
Margin Pressure Leaves Little Room for Error
The margin pressure compounds the problem further, and for Canadian brands competing against both larger CPG players and an expanding wave of private label products, execution speed is exactly where shelf space gets lost. Brands that hold onto shelf space tend to know where a production run stands at any given moment, often because they are tracking inventory, bills of materials, and production scheduling in one connected system instead of a handful of disconnected spreadsheets.
The Cost of Getting It Wrong
A missed production run rarely stays contained to a single retailer relationship. Buyers talk to each other, and a brand that repeatedly falls short on fill rate tends to get a reputation for unreliability faster than it built a reputation for quality. That makes execution reliability just as valuable to a growing brand as the product itself, especially in categories where a retailer has other, more consistent suppliers waiting for the same shelf space.
Building Production Visibility That Scales
Brands that hold onto shelf space tend to share one habit: they know exactly where a production run stands at any given moment, rather than finding out about a shortfall once a retailer’s order has already gone unfulfilled. Platforms such as Digit Software give growing brands a connected view of inventory, bills of materials and production schedules – without needing to significantly expand the operations team.
For a brand running a single co-packer relationship, a spreadsheet might hold up for a while. The moment a second production line or a new distribution centre enters the picture, that same spreadsheet usually becomes the first thing to fall behind, and it is rarely obvious until an order is missed.
What This Means for Growing Brands
Retail listings reward brands that can prove reliability, not just brands with the strongest product. As competition for Canadian shelf space intensifies, and as retailers lean further into private label and niche suppliers, the brands that hold their ground will be the ones treating production planning as seriously as they treat the pitch meeting itself.
Getting on the shelf has always been difficult. Staying there is where the real work begins.
KEO Capital has launched operations in Canada with a new subsidiary and an agreement for a revolving senior loan facility of up to $50 million with a leading Canadian bank, as the financial technology company expands its B2B payment and financing platform into the Canadian market.
The company said that its Canadian operations will be conducted through Workeo Canada, extending a platform that allows businesses to access working capital, pay suppliers, anticipate receivables and manage payments through a single digital system.
KEO Capital said the Canadian launch builds on its operations in Latin America, where it has operated since 2020. The company is establishing a local leadership team as part of what it describes as a long-term presence in Canada.
Working capital and supplier payments
The company’s Workeo platform is designed to address the timing gap between supplier payments and buyer obligations. Suppliers can wait 30, 60 or 90 days to be paid, while buyers seek to manage payment obligations and maintain supplier relationships, according to KEO.
Through Workeo, businesses can apply for financing and, once approved, obtain a revolving credit facility that can be used to extend payment terms for supplier invoices and operating expenses through the platform.
The company said the arrangement is intended to give buyers greater flexibility in managing their finances while allowing suppliers to gain faster access to receivables and improve their working capital cycle.
Workeo also uses blockchain technology to support what the company describes as secure, transparent and instant B2B payment execution for local transactions.
KEO Capital said the platform connects buyers and suppliers while providing faster access to funds and working capital. It also offers flexible payment terms, blockchain-supported transaction processing and local payment capabilities.
The financing platform is aimed at mid-market and enterprise businesses in sectors including manufacturing, construction, logistics, wholesale distribution, professional services, multi-location retail and health care.
Pavel Danilyuk photo
Canadian expansion
The company’s Canadian services are currently available in Ontario, British Columbia, Alberta, Manitoba and the Atlantic provinces. Availability may vary by province and is subject to applicable regulatory requirements. KEO Capital said its services are not currently offered in Quebec or Saskatchewan.
“Launching KEO Capital’s operations in Canada marks an important milestone in the roll-out of our Workeo platform. Establishing a foothold in such an important, dynamic, and significant market enables us to provide local-currency payment solutions to help more businesses improve cash flow, strengthen supplier relationships, and manage payments. As we grow our Canadian team and work alongside our Canadian customers, their insights will strengthen the Workeo platform,” said Marchiori.
Company structure
KEO Capital AB (publ.), previously known as Maha Capital AB, describes itself as a technology-driven financial solutions provider focused on B2B supply-chain financing and corporate travel and expense management.
The company operates a digital platform through which buyers and suppliers can interact using solutions addressing corporate payables.
KEO Capital also holds an indirect 24 per cent equity stake in Venezuelan oil company PetroUrdaneta and has entered into a binding agreement to increase that indirect interest to 40 per cent.
In an interview with Retail Insider, Marchiori talked about the company’s latest news.
Question: How significant is the late-payment problem for Canadian businesses today, and what are the biggest downstream effects you’re seeing across retail supply chains?
Answer: It’s more significant than most people outside procurement and treasury teams realize. Statistics Canada reports that 62.2% of Canadian businesses are facing cost-related obstacles and data reveals 44% of Canadian B2B credit sales as overdue.
That’s nearly half of business-to-business trade sitting past terms. Suppliers are routinely waiting to get paid, while buyers are under real pressure to hold onto cash to protect their own liquidity.
The downstream effect is a slow squeeze that moves through the whole chain. When a large buyer stretches payment terms, its suppliers stretch terms with their suppliers, and working capital that could be funding inventory, hiring or growth ends up parked in receivables instead.
In retail specifically, we’re also seeing tariff-driven uncertainty push some businesses to buy defensively, building inventory early to get ahead of potential cost increases, which ties up even more capital and adds warehousing and markdown risk on top of the payment-timing problem.
So you have two working-capital pressures compounding each other at once: slower payments and more defensive inventory. That combination is what’s actually showing up in the numbers.
KEO helps businesses close the cash-flow gap faster than traditional options, empowering buyers with greater flexibility and purchasing power while enabling suppliers to receive payment sooner.
Roberto Marchiori Thirdman photo
Q: What makes Workeo different from other working capital or invoice financing solutions already available in the Canadian market?
A: Most platforms in this space solve one side of the problem. A factoring company will advance a supplier cash against its receivables. A line of credit gives a buyer more room to pay later.
Workeo, our B2B payment and financing platform,is unique because it combines B2B payments and financing in one place, and it’s built specifically around the recurring nature of supplier relationships, not one-off transactions.
Buyers get a revolving credit facility to finance recurring inventory purchases and extend payment terms on supplier invoices, and suppliers on the other side of that same transaction get paid faster. Neither party has to separately negotiate financing; it’s built into the payment itself, and the facility renews automatically as the relationship continues, rather than requiring a fresh application every cycle.
The platform is also blockchain-powered, which means secure, transparent, and near-instant settlement rather than the multi-day reconciliation that’s typical of traditional B2B payment rails, with 24/7 visibility into where a transaction stands.
On the underwriting side, our four-step digital application typically takes about a month to establish eligibility, faster than many traditional facilities.
Q: Which types of Canadian retailers, suppliers, or industries stand to benefit most from faster supplier payments, and can you share any early examples or case studies?
A: We built Workeo for mid-market and enterprise businesses with recurring, inventory-heavy purchasing cycles, including multi-location retail, wholesale distribution, manufacturing, construction, logistics and professional services.
Retailers and distributors carrying seasonal, technology or other discretionary inventory are especially exposed right now, because that’s exactly the inventory that gets pulled forward when businesses are hedging against tariffs, which makes flexible working capital more valuable.
This is the model we’ve built and proven across Latin America, where Workeo has facilitated more than US$1 billion in financing since 2020.
Companies use inventory financing to increase purchasing power and secure better pricing on products. Manufacturers embed financing into their customer purchases to support dealers buying inventory. Resellers use flexible inventory financing to close the gap between what their suppliers demand and what their customers pay.
Multi-location retail and distribution businesses in Canada face a very similar cash-conversion gap, which is why we expect that sector to be an early and natural fit here.
Q: Why did KEO Capital choose to expand into Canada now, and what opportunities or challenges do you see in the Canadian business and retail landscape?
A: Canada is our next phase of that growth because it’s a market that’s dynamic, significant and, frankly, underserved on the working-capital side relative to its size.
The timing lines up with having a structured lending facility in place with a leading Canadian bank, which gave us the confidence and the local-currency capacity to launch properly, with a dedicated Toronto-based team rather than a remote presence.
The opportunity is real. Canada has sophisticated financial infrastructure and a large base of mid-market businesses, and right now, an environment shaped by tariffs, trade uncertainty and cost pressure means flexible working capital matters more than it did a few years ago.
We’re currently live in Ontario, British Columbia, Alberta, Manitoba and the Atlantic provinces, and not yet in Quebec or Saskatchewan, so building out that footprint responsibly is part of the work ahead. We see that as something to work through methodically, not around.
Q: Looking ahead, how do you expect payment practices and access to working capital to evolve in Canada over the next few years, particularly if economic pressures and tariffs persist?
A: If tariff pressure and trade uncertainty persist, I think we’ll see even less of an appetite for static, one-size-fits-all terms and more demand for financing that flexes with the business cycle.
Businesses that buy inventory early to get ahead of a tariff schedule need capital that can move with that decision, not a fixed loan that was sized for a different set of assumptions. That favours revolving, embedded financing over one-off borrowing.
I’d also expect the payments infrastructure itself to keep catching up.
Canada’s move toward real-time payment rails and open banking is going to make faster settlement more accessible across the board, which plays directly into what blockchain-powered platforms like Workeo already do. And as supply chains diversify away from single-market sourcing, businesses will need working capital solutions that can support new supplier relationships quickly rather than waiting on lengthy underwriting.
My expectation is that payment flexibility stops being a nice-to-have and becomes a basic competitiveness question for Canadian businesses, which is really the premise we built Workeo, our B2B financing and payment platform, around.
Amazon FBA built the modern e-commerce fulfillment playbook. It gave sellers Prime eligibility, near-guaranteed two-day delivery, and a customer service layer they did not have to staff. For a long time, that trade was worth it.
In 2026, more sellers are asking whether it still is. Storage fees have climbed, inbound placement rules have tightened, and Amazon’s fulfillment network was never designed to serve orders coming from Shopify, TikTok Shop, wholesale accounts, or a brand’s own website. A growing group of sellers are moving to Fulfillment by Merchant (FBM) and pairing it with a third-party logistics (3PL) partner that can fulfill Amazon orders alongside every other channel.
This guide covers the eight strongest Amazon FBA alternatives for FBM sellers in the United States in 2026, how they compare, and how to think about switching without losing sales momentum.
Why Sellers Look for an Amazon FBA Alternative
FBA is still a capable fulfillment engine. But the reasons sellers leave have become more consistent over the last two years, and most fall into four buckets.
Rising FBA storage and long-term storage fees
FBA storage costs have moved upward across both monthly and long-term tiers, with peak-season surcharges kicking in from October through December. Sellers carrying seasonal inventory, slow-moving SKUs, or large-format products often find that a chunk of their margin is being absorbed by storage fees before a single unit ships. The math gets worse for brands that intentionally hold safety stock to avoid stockouts during Q4.
Inflexible inbound placement and prep requirements
Amazon’s inbound placement service and stricter prep requirements have added another cost line and another operational step. Sellers now often pay per unit to have inventory distributed across FBA’s network, on top of already paying for FBA storage and fulfillment. Prep errors can trigger rejections or extra fees at the receiving dock, which is difficult to manage remotely.
No support for non-Amazon channels
FBA is built to fulfill Amazon orders. Multi-Channel Fulfillment (MCF) exists, but it uses Amazon-branded packaging by default in many cases, has separate pricing, and does not integrate cleanly with Shopify, TikTok Shop, wholesale EDI, or B2B workflows. Sellers running a multi-channel business often end up with fragmented inventory pools, one for FBA, one for everything else.
Limited control over branding and packaging inserts
FBA ships in Amazon boxes with Amazon tape. There is very little room for branded unboxing, thank-you cards, discount inserts, or sample drops. For DTC brands that treat the unboxing as part of customer acquisition and retention, this is a real constraint.
What to Look for in an FBA Alternative
Switching from FBA to a 3PL is not a straight swap. The right partner has to do several things FBA does not, without giving up the things FBA does well.
Multi-channel support in one place
A good FBA alternative fulfills Amazon FBM orders alongside Shopify, WooCommerce, TikTok Shop, eBay, Walmart, and wholesale purchase orders from one inventory pool. That removes the need to split stock across marketplaces and prevents overselling.
Transparent, pay-as-you-go pricing
FBA’s tiered storage fees and per-unit fulfillment rates are predictable but not always cheap, and surcharges add up. Look for a 3PL that itemizes receiving, storage, pick-and-pack, and outbound shipping so you can model unit economics before signing.
Fast, reliable delivery speeds
Buyers still expect two- to three-day delivery, especially on Amazon. Sellers moving to FBM need a 3PL with distributed warehouses or a well-placed hub that can hit most of the US in a similar window and support Seller-Fulfilled Prime (SFP) SLAs if maintaining the Prime badge matters.
Real-time inventory sync across all sales channels
Inventory that lags by hours is inventory you will oversell. A modern 3PL should sync stock levels across every connected channel in minutes, not overnight.
Global and cross-border fulfillment options
If you sell or plan to sell outside the US, confirm whether the provider handles cross-border logistics, customs, and Importer of Record and Seller of Record support, or whether you will need a separate partner for international markets.
Quick Comparison Table: FBA vs. Top 3PL Alternatives
Provider
Best For
Channels Supported
Global Warehouses
Pricing Model
Avg. Delivery Speed (US)
Locad
Amazon FBM sellers needing strong SLAs and multi-channel fulfillment
Amazon, Shopify, TikTok Shop, WooCommerce, 15+ more
1. Locad — Best for Amazon FBM Sellers That Need Reliable SLA Performance
Overview
Locad is a tech-enabled 3PL and cloud supply chain partner for Amazon FBM sellers in the US. It combines fulfillment operations with logistics technology to help sellers meet marketplace delivery expectations and stay operational during high-volume sales periods.
Its North American fulfillment network supports under-three-day delivery to 98% of the US. Locad also operates across Southeast Asia, Australia, and the GCC, with 25+ warehouses across 10 countries.
Key Features
3 Distributed fulfillment hubs across North America, with coverage on both US coasts
98.3% same-day fulfillment rate
99.8% inventory record accuracy
Integrations with Amazon, Shopify, TikTok Shop, Temu, eBay, and 15+ other sales channels
Peak-season features such as virtual bundling and gift-with-purchase workflows
Cross-border support including Importer of Record and Seller of Record services
Pros & Cons
Pros
Single inventory pool can serve Amazon alongside DTC and marketplace channels
Strong operational SLAs for sellers that need consistent marketplace performance
High inventory accuracy helps reduce stockouts and overselling
Built to support higher-volume sale days, promotions, and seasonal demand
Cons
Best suited to sellers with enough order volume to benefit from localized fulfillment
More advanced workflows and value-added services can increase overall fulfillment costs
Pricing
Locad uses a subscription and usage-based pricing model. Brands pay a monthly subscription, with fulfillment credits available for services such as storage, packaging, and pick-and-pack.
Why Choose Locad Over FBA?
Locad gives Amazon FBM sellers the fulfillment speed and reliability needed to meet marketplace SLAs without relying on FBA. With a 98.3% same-day fulfillment rate and 99.5% pick-and-pack accuracy, orders move quickly and accurately,
Locad also helps reduce inventory fragmentation. Amazon orders can be fulfilled from the same inventory pool used for Shopify, TikTok Shop, eBay, Temu, and other channels. That gives sellers more control over stock while avoiding the need to separate FBA inventory from the rest of the business.
2. ShipBob — Best for US-Based DTC Brands
Overview
ShipBob operates a network of fulfillment centers across the United States, Canada, the United Kingdom, the European Union, and Australia, combining company-built Innovation Centers with a wider partner network. It is one of the most recognized names in software-first DTC fulfillment.
Key Features
60+ fulfillment centers globally
Distributed inventory model to compress shipping zones
Native Shopify, BigCommerce, and Amazon FBM integrations
Branded packaging and custom inserts supported
Two-day shipping program for eligible US orders
Pros & Cons
Pros
Broad US warehouse footprint for zone-based savings
Mature software dashboard for orders and inventory
Established brand with published SLAs
Cons
Order minimums and standard-size SKU focus can exclude smaller or oversized catalogs
Pricing can rise quickly with add-ons
Pricing
Pay-as-you-go with receiving, storage, pick-and-pack, and shipping quoted separately. ShipBob typically applies minimum monthly volume expectations.
Why Choose ShipBob Over FBA?
For DTC brands whose primary channel is Shopify with Amazon as a secondary channel, ShipBob’s multi-node US network offers Prime-comparable delivery times without FBA’s storage tier structure or Amazon-branded packaging.
3. ShipMonk — Best for High-SKU-Count Brands
Overview
Headquartered in Fort Lauderdale, ShipMonk is a tech-driven 3PL with particular depth in subscription box, crowdfunding, and kitting-heavy fulfillment. Its platform is built around catalogs that carry many SKUs, frequent bundle changes, or complex assembly work.
Key Features
12 facilities across the US, Canada, Mexico, and Europe
Advanced kitting, bundling, and assembly workflows
Support for Seller-Fulfilled Prime
75+ integrations with e-commerce platforms and marketplaces
Pros & Cons
Pros
Strong operational fit for subscription boxes and high-SKU catalogs
Handles complex prep and assembly better than most competitors
Supports SFP for Amazon FBM sellers who want the Prime badge
Cons
Smaller US network than software-first competitors
Pricing structure can be complex to model at low volumes
Pricing
Tiered, volume-based pricing with separate lines for storage, pick, pack, kitting, and shipping.
Why Choose ShipMonk Over FBA?
FBA is a poor fit for brands running 500+ SKUs or subscription bundles that change monthly. ShipMonk’s operational model is designed around exactly that complexity.
4. ShipHero — Best for Brands Wanting Owned Software + 3PL
Overview
ShipHero operates in two modes. It licenses its warehouse management system (WMS) to brands and 3PLs running their own facilities, and it also runs its own 3PL network. That combination lets sellers choose between outsourcing entirely, running their own warehouse on ShipHero’s software, or a hybrid.
Key Features
Cloud-based WMS with Shopify, Amazon FBM, eBay, and Walmart integrations
Owned 3PL network across the US and Canada
Batch picking, mobile scanning, and returns workflows
Two-day shipping program
Pros & Cons
Pros
Flexibility to switch between self-fulfillment and outsourced fulfillment on the same software
Strong WMS for brands that eventually want to bring fulfillment in-house
Transparent per-order pricing
Cons
Fewer facilities than the largest 3PL networks
Self-run model requires internal operational capacity
Pricing
Software subscription for the WMS, plus per-order fulfillment fees for brands using the 3PL network.
Why Choose ShipHero Over FBA?
For sellers who want optionality — outsource today, insource later, or run a hybrid — ShipHero’s software layer travels with them. FBA does not offer that path.
5. Easyship — Best for Cross-Border Shipping Rate Optimization
Overview
Easyship is a shipping platform first and a fulfillment partner second. Its core value is aggregated access to 550+ shipping solutions across major carriers, with pre-negotiated rates that individual sellers would struggle to secure on their own. On top of that, Easyship offers fulfillment through a partner warehouse network, which makes it worth considering for Amazon FBM sellers who ship a meaningful share of orders internationally.
Key Features
550+ shipping solutions with pre-negotiated carrier rates
Rate comparison and label generation across every connected carrier
Access to 250+ partner warehouses globally for fulfillment
Duty and tax calculation at checkout for cross-border orders
Native integrations with Shopify, Amazon FBM, eBay, WooCommerce, and BigCommerce
Pros & Cons
Pros
Strong rate discounts for international shipping without volume commitments
Landed cost transparency for cross-border buyers
Flexible: sellers can use Easyship as pure shipping software or bundle in fulfillment
Cons
Fulfillment is delivered through partner warehouses, so operational consistency varies by node
Better suited to brands whose primary need is shipping optimization, not white-glove fulfillment
Pricing
Tiered SaaS plans for the shipping platform, with fulfillment quoted separately by warehouse partner.
Why Choose Easyship Over FBA?
FBA does not help with international shipments outside its own regional accounts, and its rates are not competitive for cross-border DTC orders. Easyship is designed for exactly that use case, and it works alongside a domestic 3PL rather than replacing one.
6. Stord — Best for Mid-Market and Enterprise Omnichannel Brands
Overview
Stord positions itself as a Cloud Supply Chain company, combining first-party fulfillment facilities, a wider partner network, and proprietary OMS and WMS software. The owned-network model means SOPs, picking standards, and accountability run through one operator across its first-party sites, which can simplify issue resolution for brands operating at scale.
Key Features
First-party and partner fulfillment facilities across the US and Canada
Proprietary OMS and WMS built natively alongside operations
DTC, retail, and B2B fulfillment under one contract
Reported delivery to nearly 20% of US homes for its customer base
Pros & Cons
Pros
Consistent operational standards across owned facilities
Software layer designed for enterprise-grade complexity
Handles DTC, retail EDI, and B2B under one roof
Cons
Coverage outside North America is limited
Positioned for mid-market and enterprise volume; smaller brands may not fit the model
Pricing
Custom, contract-based pricing tied to volume, storage footprint, and channel mix.
Why Choose Stord Over FBA?
FBA cannot serve retail EDI or B2B orders, and its inventory pool cannot be shared with DTC channels. Stord is built to run all three sides of an omnichannel business from one connected system.
7. Flowspace — Best for Omnichannel Brands with Retail + EDI Needs
Overview
Flowspace, headquartered in Los Angeles, runs an omnichannel fulfillment model that orchestrates a network of independently operated warehouses rather than owning every facility outright. The partner-network approach adds geographic reach faster than building owned warehouses, which suits brands that also need retail EDI compliance alongside DTC fulfillment.
Key Features
Partner-operated fulfillment network across the US
Retail EDI, B2B order workflows, and DTC fulfillment on one platform
Real-time inventory and order visibility across all connected nodes
Native integrations with Shopify, Amazon FBM, Walmart, and major retail purchase-order systems
Pros & Cons
Pros
Fast geographic expansion via partner network
Strong retail EDI and B2B order support
Flexible node selection for zone-based savings
Cons
Operational consistency varies across partner-operated sites — worth evaluating each node
Less predictable than an owned-network 3PL for high-priority SKUs
Pricing
Pay-as-you-go, with fees varying by warehouse partner and service level.
Why Choose Flowspace Over FBA?
FBA cannot process retail purchase orders or EDI documents, which is a hard block for brands that sell through Target, Walmart, or specialty retailers alongside Amazon. Flowspace handles both sides.
8. ShipFusion — Best for High-Volume DTC and Subscription Brands
Overview
ShipFusion operates fulfillment centers in Chicago, Los Angeles, Las Vegas, and Toronto, backed by a proprietary WMS built in-house rather than licensed from a third party. Its positioning is tech-enabled fulfillment for growth-stage DTC brands with meaningful daily volume, including subscription boxes and recurring orders.
Key Features
Facilities in Chicago, Los Angeles, Las Vegas, and Toronto
Proprietary WMS included in the service, not a separate SaaS charge
Support for subscription and recurring-order workflows
Native integrations with Shopify, Amazon FBM, and major subscription platforms
Cross-border coverage into Canada through the Toronto facility
Pros & Cons
Pros
Tech-forward operations without a separate software subscription
Strong fit for growing DTC brands past the ShipBob starter tier
North American coverage including Canada
Cons
Smaller network than the largest US 3PLs
Best fit for brands doing consistent daily volume; may not suit very early-stage sellers
Pricing
Pay-as-you-go with the proprietary WMS included. Typically requires minimum monthly order volume.
Why Choose ShipFusion Over FBA?
FBA does not support subscription workflows well, and its Canada coverage requires a separate account. ShipFusion handles both from one contract, which matters for DTC brands scaling North America as a single market.
Locad vs. Amazon FBA: A Detailed Comparison
Dimension
Amazon FBA
Locad
Channels served
Amazon primarily; MCF for others with restrictions
Amazon FBM plus 15+ storefronts and marketplaces from one inventory pool
Real-time sync every 3 minutes across all channels
Cross-border
Separate FBA accounts per region
One platform across North America, SEA, and Middle East, with IOR/SOR support
Best for
Amazon-only sellers who value the Prime badge above all else
Multi-channel and cross-border FBM sellers
When Amazon FBA Is Still the Right Choice
FBA is not obsolete. There are still profiles where staying on FBA is the correct call:
You sell almost exclusively on Amazon. If Amazon is 90%+ of revenue and you have no serious plans to diversify, the operational simplicity of FBA usually outweighs its fees.
Prime badge is your primary conversion driver. For commodity or highly price-competitive categories, the Prime badge lifts conversion enough to justify the cost — and Seller-Fulfilled Prime through a 3PL is possible but operationally demanding.
Your product profile is small, light, and fast-moving. FBA’s fees are least punishing on standard-size, high-velocity SKUs that do not sit in storage long.
You do not want to handle customer service. FBA absorbs returns and supports inquiries in a way most 3PLs do not by default.
The switch usually makes sense once revenue mix, product profile, or expansion plans move past those conditions.
How to Migrate Inventory from FBA to a 3PL Without Losing Sales Momentum
Migration is where most sellers get nervous, and reasonably so. Done badly, it creates stockouts, ranking drops, and a bad quarter. Done well, it is a two- to four-week transition that customers never notice.
Data export and inventory transfer checklist
Before you move a single unit, get your data in order:
Export SKU master data from Seller Central: ASINs, FNSKUs, dimensions, weights, HAZMAT flags, and prep requirements
Pull current on-hand inventory per FBA warehouse
Export the last 90–180 days of order history to model demand at the new 3PL
Document any special prep, labeling, or bundling requirements
Reconcile FBA inventory with your accounting system before the move
Identify slow-moving SKUs — it is often cheaper to liquidate them via FBA than pay removal and inbound fees to move them
Key questions to ask before switching
Before signing with a new 3PL, get direct answers on:
What is your onboarding timeline from contract signing to first order shipped?
How do you handle Amazon FBM orders specifically, including SFP if applicable?
What is your same-day cutoff time, and what percentage of orders hit it?
How is inventory synced with Amazon, Shopify, and other channels, and how frequently?
What are the receiving fees, and how are damages or shortages handled?
Is there a minimum monthly volume or storage commitment?
What does the exit clause look like if the partnership does not work?
What to expect during onboarding with a new 3PL
A typical onboarding runs like this:
Week 1 — Contracting and technical setup. Sign the SLA, connect channels via API, and configure inventory sync.
Week 2 — Inbound planning. Submit FBA removal orders in staged batches so you are not out of stock on any single SKU. Ship inbound to the new 3PL in parallel.
Week 3 — Test orders. Run a small percentage of orders through the new 3PL to validate pick accuracy, packing quality, and shipping speed before switching over completely.
Week 4 — Full cutover. Route the remaining channels to the new 3PL. Keep a small FBA safety stock for two to four weeks in case of unexpected issues.
The Prime badge question is worth flagging: moving FBA inventory to FBM will affect Prime eligibility for those SKUs unless you enroll in Seller-Fulfilled Prime, which has its own performance requirements. Plan the migration and the SFP application in parallel if the badge matters to your category.
Ready to Move Off FBA?
Locad helps FBM sellers fulfill Amazon orders alongside Shopify, TikTok Shop, WooCommerce, and every other channel from one inventory pool — with US coverage in under three days, transparent pricing, and cross-border support for brands expanding beyond the US.
Book a demo with Locad at https://www.golocad.com/contact-us/ to see how the platform fits your catalog, channels, and expansion plans.
Frequently Asked Questions
What are the best alternatives to Amazon FBA?
The strongest FBA alternatives for FBM sellers in 2026 are Locad, ShipBob, ShipMonk, ShipHero, Easyship, Stord, Flowspace, and ShipFusion. The right pick depends on channel mix, product profile, order volume, and whether you need cross-border fulfillment.
Why do sellers switch from FBA to FBM?
Sellers typically switch to reduce storage fees, gain control over branded packaging, fulfill multi-channel orders from one inventory pool, and remove the operational constraints of Amazon’s inbound placement and prep rules. Cross-border sellers also switch to avoid running separate FBA accounts per region.
Is it cheaper to use a 3PL instead of FBA?
Often yes, especially for slow-moving SKUs, oversized items, or brands that keep safety stock. FBA’s tiered storage fees and long-term storage surcharges can add up quickly, while most 3PLs use itemized pay-as-you-go pricing. The comparison depends on your exact SKU velocity and product dimensions — model it with an itemized quote from any 3PL you evaluate.
Can a 3PL fulfill Amazon orders as well as other channels?
Yes. A modern 3PL fulfills Amazon FBM orders alongside Shopify, TikTok Shop, WooCommerce, Walmart, and wholesale from the same inventory pool. Some 3PLs also support Seller-Fulfilled Prime, which lets FBM sellers keep the Prime badge on eligible listings.
How long does it take to migrate inventory from FBA to a 3PL?
A typical migration runs two to four weeks. Week one covers contracting and technical setup, weeks two and three cover staged FBA removals and test orders at the new 3PL, and week four is the full cutover. Most sellers keep a small FBA safety stock for a few weeks after cutover as a hedge.
Does switching away from FBA affect Amazon search ranking (Prime badge)?
Moving inventory out of FBA affects Prime eligibility on those SKUs unless you enroll in Seller-Fulfilled Prime (SFP). SFP has performance requirements around on-time shipping and cancellation rates, so it is worth planning the SFP application in parallel with the migration if the Prime badge matters in your category. Search ranking is influenced by more than badge status — conversion rate, review velocity, and advertising spend continue to matter regardless of fulfillment model.
Diamonds aren’t the only precious stones that are a woman’s best friend. And at Mera Jewelry, that philosophy is woven into every collection.
Founded by Katherine Paul, Mera Jewelry is a fine jewelry brand built on exceptional craftsmanship, thoughtful design, and a deep appreciation for the stories gemstones carry. While the brand works with diamonds, sapphires, and other precious stones, emeralds hold a particularly meaningful place in its identity.
Originally from Colombia and trained at the Gemological Institute of America (GIA), Paul brings both personal heritage and technical expertise to her work. That perspective has become especially relevant as Colombian emeralds continue to attract attention from luxury buyers seeking gemstones that offer rarity, character, and a strong sense of provenance.
The renewed interest in emeralds doesn’t signal a decline in the popularity of diamonds or other precious gemstones. Instead, it reflects a broader shift in consumer preferences. Today’s buyers are increasingly interested in understanding where their jewelry comes from, how it’s crafted, and what makes it unique.
For retailers and jewelry brands alike, the growing demand for Colombian emeralds offers insight into how luxury purchasing decisions are evolving.
Why Colombian emeralds continue to capture attention
Emeralds have been prized for centuries, but Colombian emeralds occupy a particularly respected position in the jewelry industry.
Known for their vivid green color and remarkable depth, Colombian emeralds have long been considered among the finest in the world. Their reputation stems from a combination of geological conditions, rarity, and a history that has connected them to royalty, collectors, and luxury houses across generations.
What makes them especially appealing today is that they offer something many luxury consumers are actively seeking: distinction.
No two emeralds are identical. Each stone possesses unique characteristics, from subtle variations in color to naturally occurring inclusions that make it recognizable from any other gemstone. For buyers looking for something personal rather than predictable, that individuality carries significant appeal.
Heritage, expertise, and the growing appeal of emeralds
One reason consumers often turn to trusted jewelers when purchasing emeralds is that evaluating these stones requires experience. Color, transparency, cut, and origin all influence quality in ways that are not always obvious to the average buyer. Understanding those differences can significantly impact both the beauty and long-term enjoyment of a piece.
For Paul, that expertise comes from both education and personal connection. Growing up in Colombia gave her an appreciation for the country’s rich emerald heritage from an early age. Later, her training at GIA provided the technical foundation necessary to evaluate gemstones at the highest level.
Together, those experiences inform Paul’s approach to design at Mera Jewelry. Whether working with emeralds, diamonds, or sapphires, the focus remains the same: helping clients understand the qualities that make a piece exceptional and creating jewelry that reflects both craftsmanship and meaning.
The continued appeal of heirloom jewelry
Another reason emeralds have gained attention is their natural connection to heirloom design. Many luxury consumers are becoming more intentional about the pieces they purchase. Rather than accumulating large collections, they are investing in fewer items with greater personal significance.
Jewelry often occupies a unique place within that mindset because it can be worn, enjoyed, and eventually passed down. A thoughtfully designed piece becomes more than an accessory. It becomes part of a family’s story.
This philosophy is central to Mera Jewelry’s approach. Designs featuring emeralds, diamonds, sapphires, and symbolic motifs such as butterflies and clovers are created with longevity in mind. The goal isn’t simply to create something beautiful for today, but something that remains meaningful years from now.
What this means for fine jewelry retail
The growing popularity of Colombian emeralds reflects larger changes taking place throughout luxury retail. Consumers are asking more questions, researching purchases more carefully, and looking beyond brand names to understand craftsmanship, sourcing, and quality. For jewelry brands, this represents an opportunity to build stronger relationships through education and expertise.
At Mera Jewelry, that approach begins with helping clients understand the stories behind the stones they wear. Whether choosing an emerald because of its Colombian heritage, a diamond for its timeless appeal, or a sapphire for its symbolism, today’s buyers want purchases that feel intentional.
The rise of Colombian emeralds is ultimately part of a larger movement within luxury retail — one that values individuality, craftsmanship, and connection. And for brands like Mera Jewelry, those qualities have never gone out of style.