EMERGE Commerce Ltd. has appointed Michael Murphy as chief financial officer and corporate secretary, effective May 4, as part of a management transition that also sees outgoing interim CFO Dasha Enenko remain with the company in a consulting role.
The Toronto-based e-commerce company said the move is intended to support continuity in its finance function while strengthening leadership as it advances its growth and capital allocation plans.
Murphy succeeds Enenko, who will continue to support the company in an ongoing consulting capacity, reporting to him.
Murphy brings more than 25 years of finance and leadership experience across public and private equity-backed companies, the company said. He has served as chief financial officer and senior advisor to multiple businesses, overseeing finance operations during periods of growth and transformation.
His background includes leadership roles at larger organizations such as Dye & Durham Limited, Allied Nevada Gold Inc. and Acasta Enterprises Inc., as well as work with smaller, high-growth companies including Quisitive Technology Solutions Inc. In that role, the company said, he helped scale the finance organization during a period of expansion from about $20 million in annualized revenue to more than $150 million.
Murphy’s experience spans mergers and acquisitions, financings, cost optimization initiatives, restructuring and financial systems implementation. He began his career at PwC, where he worked on Canadian and international public company transactions, regulatory compliance and financial reporting.
He holds a bachelor of arts in economics from the University of Western Ontario and an accounting diploma from Wilfrid Laurier University, and is a Chartered Professional Accountant in Canada.
“On behalf of the EMERGE team, I am pleased to welcome Michael as our CFO and Corporate Secretary. His depth of experience scaling public companies and leading high-performing finance teams will be instrumental as we execute on our next phase of growth and capital allocation. We’d also like to extend our sincere gratitude to Dasha for her partnership, in her role as interim CFO, during a period of immense progress at EMERGE. We are pleased she will remain involved in a consulting capacity, under Michael’s leadership, and ensure continuity across the finance function.”
EMERGE describes itself as an acquirer and operator of profitable e-commerce brands and technologies across direct-to-consumer and business-to-business segments.
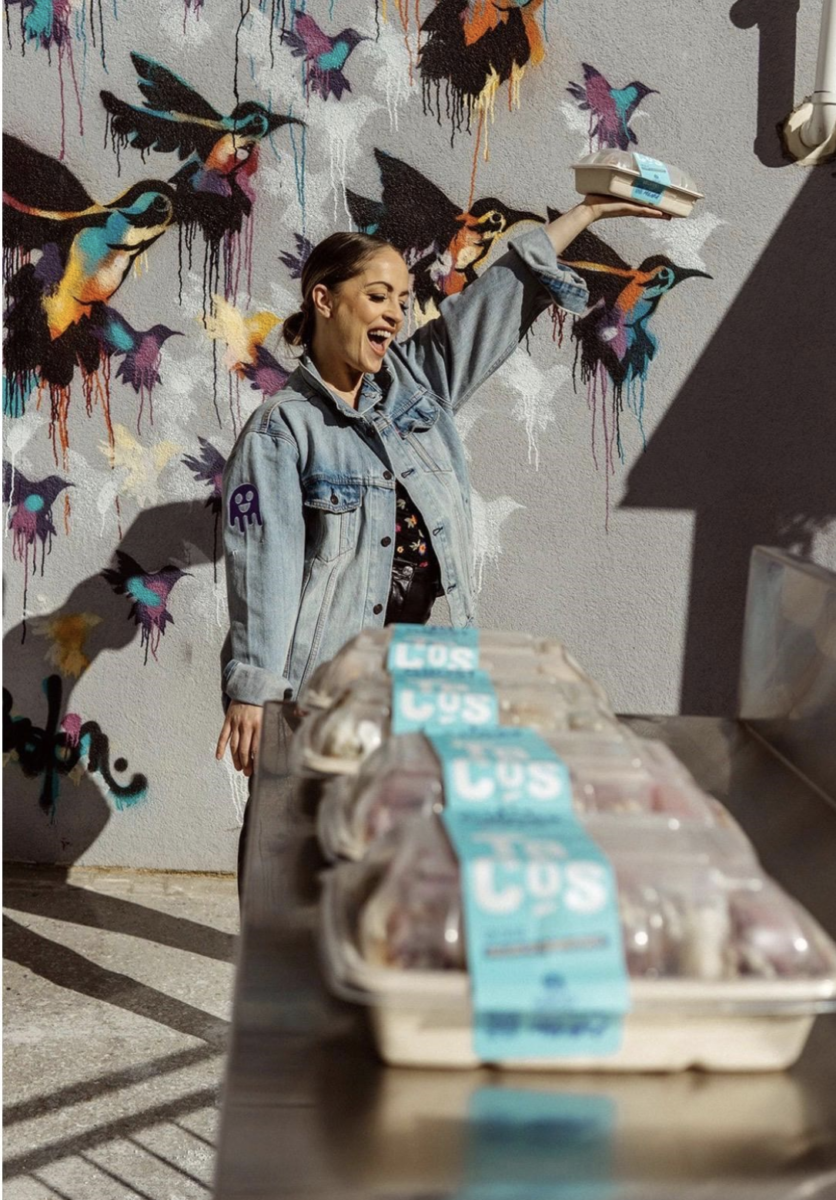
Its direct-to-consumer portfolio includes grocery and golf-related businesses. The company’s grocery segment is anchored by truLOCAL, a Canadian meat and seafood subscription service. Its golf vertical includes UnderPar, JustGolfStuff and Tee 2 Green, which focus on discounted golf experiences, apparel and equipment.
The company’s business-to-business segment includes Viral Loops, a referral marketing platform serving international clients.
EMERGE is publicly traded on the TSX Venture Exchange under the symbol “ECOM.”
Shopping cart in a Canadian grocery store. Frozen goods. Dairy. Photo: RI/Google
We learned last week that Apotex Inc., Canada’s largest drug manufacturer, has received approval from Health Canada to market a generic version of Ozempic. This is a pivotal moment. What began as a treatment for diabetes has quickly evolved into something far more consequential: a structural force reshaping consumer behaviour and, by extension, Canada’s agri-food economy. Are these drugs will now get cheaper.
GLP-1 drugs, including Ozempic and Wegovy, are no longer niche medical interventions. They are becoming mainstream. Based on estimates from our lab, by the end of this year, more than two million Canadians could be using these drugs primarily for weight loss. More recent data suggest adoption is already approaching 8% of the adult population, roughly three million people, up from about 4 to 5% in late 2025. In just over a year, usage has effectively doubled.
This is not merely a healthcare story. It is a demand shock.
Emerging consumer data show that individuals on GLP-1 therapies reduce their caloric intake significantly, often by 20% or more, and cut grocery spending by roughly 5% within months of starting treatment. At the individual level, that may seem modest. At scale, it is anything but.
Our estimates suggest that GLP-1 adoption is already removing between $2.3 billion and $3.4 billion annually from Canada’s agri-food economy, including both retail and foodservice. For an industry built on volume and operating on thin margins, this is material.
There is also a notable transfer of value underway. Novo Nordisk, the manufacturer of Ozempic, generated approximately $2.9 billion in revenues from the drug in 2025 alone. In effect, a portion of consumer spending once allocated to food is now being redirected toward pharmaceuticals.
The impact, however, is far from uniform. It is concentrated in categories that have long driven growth and profitability across the food sector. Snack foods, confectionery, sweet bakery items, and soft drinks are among the hardest hit. These are impulse-driven, high-margin categories and precisely the types of products GLP-1 users tend to abandon. Alcohol is also under pressure, both in retail and foodservice settings.
Even traditionally resilient categories such as fresh meat and deli are seeing softer demand, not because consumers are avoiding protein, but because they are simply eating less overall.
At the same time, a subtle but important shift is emerging. Consumers on GLP-1s are not necessarily trading down. They are buying less, but often choosing better. Nutrient density, portion control, and intentional purchasing are gaining importance. In economic terms, the food sector is quietly shifting from a volume-driven model to a value-driven one.
A chef in a kitchen in a restaurant in Toronto
For the restaurant industry, the implications are equally significant. Fewer appetizers, fewer desserts, fewer add-ons, and lower average tickets. With Canada’s foodservice sector exceeding $100 billion in annual sales, even modest behavioural changes translate into hundreds of millions of dollars in lost revenue.
And this is just the beginning.
With the introduction of generic semaglutide, prices are expected to fall, further accelerating adoption. If penetration reaches 10% of the adult population, as many analysts now consider plausible, the economic impact could double. Entire product categories may face a permanent reset.
Yet, despite the magnitude of this shift, there is remarkably little discussion at the policy level.
We devote considerable attention to food inflation, carbon pricing, and supply chain disruptions. These are all important issues. But we are overlooking a structural change in demand that could redefine the economics of the entire agri-food sector.
For producers, processors, and retailers, this is not a temporary disruption. It is a long-term adjustment.
The agri-food sector has always adapted to change. But this time, the change is coming from the consumer’s biology, not just preferences, prices, or policy.
And that may be the most disruptive force of all.
If Canada is serious about building a resilient and competitive food system, we need to start paying closer attention, not just to what food costs, but to how much of it people will actually want to consume in the future.
Ceremony moment – from left to right: Calvin Chen (President and CTO, Segway Navimow), George Ren (CEO, Segway Navimow), and Frank Holzmann (Global Vice President of TÜV Rheinland Business Field Electrical) with the 1,000,000th Navimow robotic lawnmower.
Segway Navimow says it has produced its one millionth robotic lawn mower, marking a milestone as the company scales its global manufacturing and supply chain operations.
The China-based company said the announcement coincides with the launch of a new production line in Malaysia, a move it says is aimed at improving delivery efficiency and supporting international growth.
The company marked the production milestone with a ceremony at its research, development and manufacturing base in Changzhou, China.
“This milestone is just the beginning. We hope to become a model for ‘new quality productivity’ going global, making ‘made in China’ synonymous with efficiency, reliability, and sustainability in the home.”
George Ren
The company said reaching one million units reflects both market demand and its ability to manage production and logistics at scale. It also said it has been named the top brand globally in wire-free robotic lawn mower retail volume sales for two consecutive years.
The milestone represents what the company describes as a transition from an early entrant in the category to a larger-scale global player.
Segway Navimow said its products are now sold in more than 40 countries and regions, supported by a network of more than 5,000 offline retail stores.
The company attributed its growth to continued investment in technology, distribution channels and service delivery. It also cited sales performance during major online retail events in 2025, when it ranked first in its category across six European countries during Amazon Prime Day and Black Friday promotions.
The company said its production capabilities span research, manufacturing and delivery, with two primary bases in Changzhou and Nantong, China.
It said the addition of a Malaysia production line is intended to support more stable supply to European and North American markets while building capacity for further expansion.
Segway Navimow traced its growth from initial deliveries of thousands of units in 2022 to steady annual increases culminating in the current production total.
Segway Navimow photo
The company said it plans to continue focusing on technological development and user-driven product design as it targets further expansion in the global market for wire-free robotic lawn mowers.
Segway Navimow is a subsidiary of Ninebot Ltd. and develops intelligent service robots, including a range of robotic lawn mowers designed for residential and commercial use.
Today’s Retail Insider articles include key insights into Primaris REIT’s $175–225 million effort to repurpose former Hudson’s Bay anchor spaces into more flexible, diversified retail formats, reflecting a pivotal shift in mall management strategies. Meanwhile, Splitsville Bowl is accelerating its Canadian expansion, targeting mixed-use and retail hubs to boost experiential foot traffic through multi-use entertainment centres. These developments and oters underscore the growing emphasis on adaptable real estate and immersive retail experiences shaping Canada’s retail future. Below, you’ll find these stories alongside Canadian Retail News From Around the Web.
Operating FFO per unit of $0.35, representing YoY growth of 7.6%
Same Property NOI growth of 6.3%, excluding bad debt expense (recovery) and lease termination fees
Lease renewal lift of 16.4% on strong leasing volume
Total portfolio occupancy of 97.2%, representing an increase of 30 basis points year-over-year
Adam Paul
“We are pleased to report another strong quarter of operating and financial results, highlighted by record occupancy, solid same-property NOI growth and robust lease renewal spreads which contributed to strong FFO per unit growth,” said Adam Paul, President & CEO.
“I am extremely grateful for and proud of the FCR team. Together, we have built a consistent track record of strong results through the disciplined execution of a well-defined strategy. This foundation positioned FCR for success and culminated in last month’s announced agreement to be acquired at a record unit price.”
On April 16, the Trust announced it had entered into an agreement to be acquired by KingSett Capital and Choice Properties REIT, in a unit and cash transaction valued at approximately $9.4 billion, including the assumption of certain debt. Under the terms of the agreement, First Capital unitholders will receive consideration of $19.24 in cash and 0.3186 units of Choice Properties per First Capital unit. Based on the closing unit price of Choice Properties on April 15, (the last trading day prior to the announcement of the transaction), the implied value of the total consideration equates to $24.40 per First Capital unit. The actual value of the consideration received by unitholders will depend on the market price of Choice Properties units at the time of closing and may be more or less than $24.40 per First Capital unit. The Transaction will be implemented by way of a statutory plan of arrangement and be subject to unitholder approvals to be obtained at a special meeting of First Capital unitholders to be held on June 23. In addition to unitholder approval, the transaction is subject to court approval, compliance with the Competition Act (Canada) and certain other closing conditions customary in transactions of this nature, explained the Trust.
First Capital owns and operates, acquires, and develops open-air grocery-anchored shopping centres in neighbourhoods with the strongest demographics in Canada.
Oval at Yorkville Village. Image: First Capital REIT
The REIT also noted in its financial results:
Net income (loss) attributable to Unitholders of $92.2 million or $0.43 per diluted unit compared to $84.4 million or $0.39 per diluted unit for the prior year period. The increase in net income over prior year was primarily due to a $30.0 million increase in fair value of investment property recognized in the first quarter of 2026 versus a $2.5 million increase in fair value of investment property recognized in the first quarter of 2025, on a proportionate basis. The increase was partially offset by a change in deferred income taxes of $17.7 million over the prior year period;
Total Same Property NOI increased 6.4% over the prior year period. The growth was primarily due to rental rate growth and higher year-over-year occupancy. Same Property NOI excluding bad debt expense (recovery) and lease termination fees increased 6.3%;
On a quarter-over-quarter basis, total portfolio occupancy increased 0.1% to 97.2% at March 31, 2026, from 97.1% at December 31, 2025. On a year-over-year basis, total portfolio occupancy increased 0.3% from 96.9% at March 31, 2025 to 97.2% at March 31, 2026;
During the quarter, net rental rates increased 16.4% on a volume of 578,000 square feet of lease renewals, when comparing the rental rate in the first year of the renewal term to the rental rate in the last year of the expiring term. Net rental rates on leases renewed in the quarter increased 20.1% when comparing the average rental rate over the renewal term to the rental rate in the last year of the expiring term owing to higher contractual growth rates embedded within the renewed lease terms;
The portfolio average net rental rate increased by 0.3% or $0.08 per square foot over the prior quarter to a record $24.81 per square foot, primarily due to rent escalations and renewal lifts, largely offset by tenant openings, net of tenant closures;
During the first quarter, First Capital invested approximately $43 million into property development, redevelopment, residential inventory and acquisitions, including a parcel of excess land adjacent to an existing FCR-owned shopping centre located in Milton for $5.2 million.
Running your retail business comes with multiple things to think about every day so that it can operate smoothly. As most aspects of planning, growing your company, and making improvements require financing, money remains one of the key components that entrepreneurs often worry about. Below, we provide options for small business grants that can support their owners.
General Small Business Grants
These grants offer non-repayable financing for startups and existing businesses in specific industries and demographics. You can get them through Small Business Administration (SBA) local development centers, state agencies, and the Grants.gov website. The most common options include:
National Association for Self-Employment (NASE) Growth Grants. NASE grants are awarded quarterly for four winners, allowing them to get up to $4,000 to grow their businesses.
U.S. Department of Commerce Minority Business Development Agency (MBDA). This network of programs targets minority-owned businesses and supports their growth. Each program targets a specific minority category, for example, American Indians, Alaska Natives, Native Hawaiians, or women of color.
Awesome Foundation Grants. Awesome Foundation is a global community that issues micro-grants of up to $1,000 each month to bring brilliant and crazy business ideas to life. The foundation also supports novel or experimental businesses.
The Freed Fellowship Grant. Through this grant, a chosen Freed Fellow business owner will receive $500 to invest in their company growth and can become eligible for a $2,500 year-end grant. Every submission gets feedback with recommendations on growing your business.
Storefront Opportunity Grant. This option provides funding from $25,000 to $100,000 to help small businesses that open brick-and-mortar locations offset frost-year operating costs. To qualify, you need to have a revenue-generating business for at least 3 years, 100 or fewer employees, and $5 million or less in annual revenue. Eligibility may vary by location.
U.S. Economic Development Administration (EDA). As a part of the U.S. Department of Commerce, EDA provides financial support to businesses that boost regional and national economic development.
Smart Loan Options from Digital Lenders
Financial strains often hit small businesses the hardest. When you’re just getting a retail business off the ground, scrambling to cover the cost of a damaged roof or flood repairs can be overwhelming. In such a situation, small loan lenders in the USA can provide much-needed support without the need for expensive paperwork associated with taking out a loan from lenders certified by CDFI. Most of these companies have installment loan assistance for entrepreneurs who want to grow their respective retail companies. This type of loan helps businesses build solid disaster preparedness plans ahead of time and offer emergency funding when the unexpected strikes.
To qualify for funding, businesses simply need to complete a straightforward application process. It typically involves filling out an online loan request form and attaching copies of your basic documents, such as your ID, proof of address, and income confirmation. Funding typically takes 1 business day. Just note that interest rates may be higher compared to CDFI or traditional financing options.
Government Contract Assistance
The government reserves at least 23% of contracting dollars for small businesses seeking to secure government contracts. Such assistance is primarily available through the SBA and the Department of Defense. Here are the four options available:
Women-Owned Small Business Federal Contracting Program. The federal government awards at least 5% of contract dollars to small businesses owned by women.
Service-Disabled Veteran-Owned Small Business Program. Minimum 3% of contracts must be secured by veterans or service-disabled veterans running small businesses.
HUBZone Program. Under this program, businesses located in historically underutilized business zones get preferential consideration.
8(a) Business Development Program. The program targets socially or economically disadvantaged business owners.
Natural Resource Sales Assistance Program
The Natural Resource Sales Assistance Program, created by the SBA, channels a certain percentage of the natural resources and surplus property sold by the federal government to small businesses through bidding. Sales occur in five resource categories: “timber and related forest products,” “strategic materials,” “royalty oil,” “leases involving rights to minerals, coal, oil, and gas,” and “surplus real and personal property.”
Federal agencies may also divide surplus materials into smaller lots that are much easier to purchase for startups and small companies. On top of that, the program allows small businesses to participate in training on government sales and leasing.
Final Thoughts
For many small retail businesses, grants can be a great source of financial support. Entrepreneurs can use the funds to cover operating costs, grow sales, and improve processes or their company’s presence. Just note that getting free money from the government or community services often comes with extensive paperwork. Before applying, check eligibility criteria, application requirements, and deadline.
FAQ
What is the most important funding source for small businesses?
Personal savings and retained business revenue (bootstrapping) are the most common and important funding sources for small businesses. Other options could be: grants, cash advances via online app, and government contact assistance. Those could be used at certain stages to support growth or make it easier to maintain stability during tough times.
How to obtain a grant for a small business?
Grants are awarded based on your preliminary application. The application process and deadlines may vary by program, so check out the website of an agency or company awarding this particular grant. In most cases, you will be asked to provide a set of documents, including tax returns, a business plan, and bank statements. Specific eligibility requirements associated with legal registration, operational history, and financial limits may apply.
How to get funding for a retail business?
If you search for non-repayable options, consider grants based on the amount you need, the goal, and your company’s specifics. Alternatively, you can turn to loans from online loan companies or SBA- and CDFI-certified lenders. If your retail business is designed to support communities, you can also launch a fundraising program.
As part of Retail Insider Reports, this Q1 2026 Home Furnishings Retail Report provides structured analysis of the Canadian home furnishing sector, drawing on Retail Insider’s ongoing coverage to identify key market dynamics, emerging trends, and strategic shifts. These reports are designed to deliver executive-level insights across major retail sectors and can be accessed through the Retail Insider Report Hub.
****
The Canadian home furnishings sector entered 2026 at a crossroads, balancing expansion ambitions with shifting consumer behaviour and operational realities. While some retailers are investing in physical retail and experiential formats, others are pulling back from costly store networks in favour of wholesale and omnichannel strategies.
Underlying these decisions is a more cautious consumer environment. Housing activity, a key driver of furniture demand, remains uneven. National home sales were down 2.3% year-over-year as of March 2026, reflecting a slower start to the year, even as forecasts point to a potential rebound later in 2026 driven by pent-up demand.
This dynamic is creating a landscape where growth remains possible, but increasingly selective. Leading players are adapting through channel diversification, strategic investment, and operational discipline, while others face mounting pressure.
Casavogue’s targeted promotions and focus on Canadian craftsmanship, Richelieu Hardware’s acquisition-driven expansion, and Article’s evolution from digital-first to omnichannel retail illustrate how leading companies are repositioning. Meanwhile, Yankee Candle’s exit from Canadian stores underscores the challenges facing specialty retailers tied to traditional mall-based formats.
Home Furniture store in St. Jacobs, Ontario. Photo: Simon Zhang via Google Maps/Images
Retail Insider Coverage Reflects Sector in Transition
Retail Insider tracked 35 home furnishings-related articles in Q1 2026, reflecting continued activity across the sector. Expansion and store openings led coverage, followed by product launches, partnerships, and financial reporting.
This activity translates into tangible market movement. Article’s 9,600-square-foot Toronto showroom signals a major investment in physical retail, while regional expansions such as Atlantic Gift + Home Market highlight localized growth. At the same time, Richelieu Hardware’s completion of 10 acquisitions across North America points to ongoing consolidation shaping supply chains and retail assortments.
Despite these developments, contraction remains part of the story. Yankee Candle’s closure of its final Canadian store highlights the challenges facing certain specialty formats, reinforcing the uneven nature of growth across the sector.
Channel Evolution Defines Competitive Positioning
The home furnishings sector is increasingly defined by how effectively retailers integrate physical and digital channels.
Yankee Candle’s exit from Canadian brick-and-mortar retail after 14 years reflects a broader pivot toward wholesale and omnichannel distribution. By shifting to major partners such as Canadian Tire and Walmart, alongside e-commerce platforms, the brand reduces fixed costs while maintaining market presence.
In contrast, Article’s expansion into physical retail represents a strategic investment in omnichannel engagement. Its new Toronto showroom complements its digital platform by offering tactile product experiences and design services, addressing a key limitation of online-only furniture retail.
Cozey’s continued expansion into physical retail further reinforces the role of showrooms in building consumer confidence. Despite its digital origins, the company recognizes that customers still value in-person interaction for higher-ticket purchases.
Together, these strategies illustrate a clear pattern. Physical retail is not disappearing, but it is evolving into a more targeted, experience-driven component of broader omnichannel strategies.
Market Consolidation and Supplier Influence Expand
Richelieu Hardware’s 7.2% sales growth in 2025, supported by 10 acquisitions, highlights the growing role of consolidation in shaping the home furnishings ecosystem. The company’s expansion of private-label brands and product categories strengthens its position as a key supplier to retailers and renovation markets.
This trend has broader implications. While retailers benefit from streamlined sourcing and expanded assortments, increased supplier concentration can shift bargaining power and influence product availability.
Over time, this may reshape assortment strategies, requiring retailers to balance efficiency with differentiation in order to maintain competitive positioning.
Consumer Financing and Incentives Support Demand
In a more cautious spending environment, retailers are increasingly turning to financing and targeted promotions to drive demand.
The Canadian furniture market is projected to reach approximately $20.2 billion in 2026, supported in part by stable demand in segments such as home office furnishings, which continue to benefit from hybrid work trends. However, this growth is occurring alongside increased price sensitivity.
Financing solutions are playing a growing role. The Canadian buy now, pay later market is expected to reach approximately $13 billion in 2026, with furniture and home furnishings among the leading categories for adoption. These tools allow consumers to manage higher-ticket purchases through instalment payments, helping to sustain demand despite broader affordability pressures.
Australian furniture retailer King Living
Operational Pressures and External Disruptions Persist
Operational challenges continue to shape performance across the sector. Leon’s Furniture’s recent results highlight the impact of external disruptions, including logistics challenges and weather-related factors, on sales and promotional timing.
Despite these pressures, larger operators with established omnichannel platforms and strong balance sheets have demonstrated resilience. Their ability to manage inventory, control costs, and adapt promotional strategies remains a key differentiator.
For smaller or less diversified players, these challenges can have a more pronounced impact, particularly in a market where demand is increasingly selective.
Demographics and Local Demand Drive Opportunity
Consumer demand in home furnishings is becoming more concentrated among specific demographic segments, including higher-income households and homeowners engaged in renovation or long-term housing investment.
This shift reinforces the importance of targeted retail strategies. Retailers that align product assortments, store locations, and marketing efforts with these high-value segments are better positioned to capture demand.
At the same time, growing interest in Canadian-made products is influencing purchasing decisions, supporting retailers that emphasize local sourcing and craftsmanship.
Sector Outlook: Selective Growth in a More Disciplined Market
The Canadian home furnishings sector is not contracting uniformly, but rather evolving toward a more disciplined and targeted growth model.
While overall market value continues to expand modestly, performance is increasingly tied to execution. Retailers that combine omnichannel capability, operational efficiency, and customer-focused strategies are better positioned to succeed.
At the same time, rising costs and cautious consumer behaviour will continue to challenge less adaptable formats, reinforcing the importance of strategic clarity.
Editor’s Take
The most important development in Q1 2026 is the sector’s transition toward integrated omnichannel models supported by more disciplined operations and evolving consumer financing strategies.
Richelieu Hardware stands out for its acquisition-driven growth and expanding influence across the supply chain. Article’s continued investment in physical retail reflects a thoughtful approach to omnichannel development, while Casavogue’s targeted promotions demonstrate how retailers can stimulate demand in a price-sensitive environment.
At the same time, Yankee Candle’s exit from Canadian stores highlights the risks associated with legacy retail formats that lack flexibility. Retailers that fail to adapt to changing channel dynamics or consumer expectations may continue to lose relevance.
Looking ahead, the trajectory of housing activity will remain a critical factor influencing demand. The continued growth of financing solutions such as buy now, pay later will also shape purchasing behaviour, particularly for higher-ticket categories.
Together, these trends point to a sector that remains viable, but increasingly selective, where success depends on alignment with both consumer expectations and economic realities.
Loblaws at Humbertown Plaza in Toronto. Photo: Loblaw Companies
EQB Inc. and Loblaw Companies Limited announced Tuesday that final approval has been received from the Federal Minister of Finance and National Revenue for EQB’s previously announced acquisition of PC Financial from Loblaw.
The completion of the acquisition will cement EQ Bank’s position as Canada’s Challenger Bank and its unique ability to strengthen competition and drive innovation, while making a meaningful difference for millions of Canadians at a time when it matters most, said the company in a news release.
The Minister’s approval represents the successful conclusion of a comprehensive regulatory review, following a recommendation from the Office of the Superintendent of Financial Institutions (OSFI) and clearance from the Competition Bureau in March 2026, it said.
Chadwick Westlake
“We applaud the swift actions of the Federal government to enable us to move with pace to drive improvement in banking competition, affordability and innovation for Canadians,” said Chadwick Westlake, President and CEO, EQB. “This approval signals the government’s clear commitment to strengthening Canada’s economy and fostering competition and innovation here at home. It is an important step towards closing the acquisition of PC Financial and to building a more dynamic banking system. We are focused on scaling a Challenger‑led, loyalty‑linked banking ecosystem that puts more choice, value and financial momentum in the hands of everyday Canadians.”
Completion of the Acquisition will mark a step‑change for EQ Bank and for Canadian banking, unlocking the opportunity for EQB to offer Canadians rewarding and unique ways to save, spend, and earn at scale in communities from coast to coast. Through the Acquisition, EQB expects to expand its total customer base to 3.3 million Canadians and add approximately $5.8 billion in assets and $800 million in direct retail deposits. As the exclusive financial services partner of PC Optimum™, one of Canada’s most recognized and widely used loyalty platforms, EQB will be able to offer everyday banking, lending, payments, and rewards through a single integrated ecosystem to the more than 18 million active PC Optimum™ loyalty members.
“This acquisition unlocks significant benefits for millions of PC Financial customers and PC Optimum™ members, including a wider variety of products, services, and even more ways to earn rewards, while gaining access to EQ Bank’s leading digital platform for everyday banking,” said Richard Dufresne, Chief Financial Officer, Loblaw.
Richard Dufresne
With the final regulatory approval obtained, EQB and Loblaw are preparing for the closing of the Acquisition, which will combine PC Financial, including the PC Mastercard suite of products, with the award-winning EQ Bank banking platform. Building on existing everyday banking, residential lending and reverse mortgage offerings, this will shape a complete, integrated Personal Banking business that raises the bar for what Canadians can expect from their bank, said the news release.
“EQB will enter into a long-term strategic commercial arrangement with Loblaw, becoming the exclusive financial partner of the PC Optimum loyalty program with access to Loblaw’s national retail and digital channels to market financial services products,” it said.
EQB expects the acquisition to close in the summer of 2026, subject to customary closing conditions.
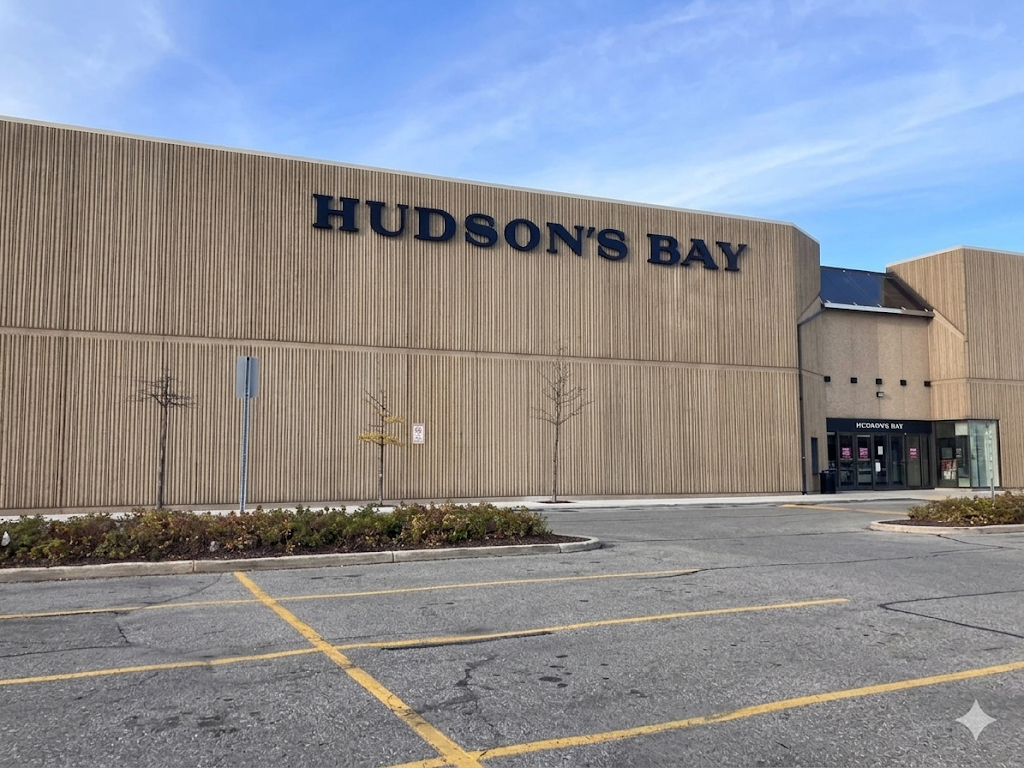
Hudson's Bay store at Devonshire Mall in Windsor, ON. Photo: TripAdvisor
Primaris REIT is advancing a significant strategy to repurpose large-format retail space across its portfolio, positioning former department store locations as a key driver of future growth. Insights shared during the company’s recent annual meeting and analyst call reveal how the landlord is actively redeploying space vacated by legacy anchors into higher-performing uses, reflecting a broader structural shift in Canadian retail real estate.
Executives speaking on the call framed the transition in stark terms. “The departure of Hudson’s Bay is the best thing that has happened to Primaris in many, many years,” said Primaris CEO Alexander Avery, pointing to the removal of long-standing lease restrictions and the ability to fully reposition large-format space. The comments were made during the REIT’s annual meeting and analyst call, underscoring how dramatically sentiment has shifted around the role of traditional department store anchors from years past.
Primaris CEO Alexander Avery
Anchor Closures Unlock Flexibility Across the Portfolio
The exit of Hudson’s Bay Company in 2025 marked a turning point for landlords across Canada, many of whom had already been contending with years of anchor erosion following the collapse of Sears Canada and earlier disruptions tied to Target’s failed expansion into the country.
For Primaris, the departure of Hudson’s Bay has removed restrictions embedded in legacy leases, including limitations on redevelopment and site configuration. As a result, the REIT now has significantly greater flexibility to reconfigure space in ways that better align with modern retail demand.
Rather than attempting to replace department stores with similar formats, Primaris is pursuing a more diversified tenant mix, reflecting the growing importance of mid-sized retailers, service-oriented uses, and more flexible store formats within enclosed shopping centres.
$175 Million to $225 Million Redevelopment Program Targets Former Bay Stores
Primaris is now deploying between $175 million and $225 million to reposition 11 former Hudson’s Bay locations across its portfolio, with targeted returns of 8 percent to 10 percent. The scale of the investment highlights how landlords are increasingly taking an active role in reshaping their properties rather than waiting for traditional anchors to return.
The REIT’s approach reflects a structured response to a challenge that has emerged across the country. Across its portfolio, Primaris is actively repositioning former department store space, with redevelopment activity already underway in select locations as large-format retail is reconfigured for new uses.
Former Hudson’s Bay at Lime Ridge Mall in Hamilton. Photo: RI/Google
A New Playbook for Repurposing Large-Format Retail Space
During the call, Avery outlined a flexible, market-driven approach to repurposing former anchor boxes, emphasizing that each asset is being evaluated individually to “maximize the value and appeal of the shopping centre.”
In some cases, Primaris is backfilling space with a single large-format tenant, including retailers such as Canadian Tire, Walmart, or Loblaw. In others, the REIT is subdividing space to accommodate multiple mid-sized tenants, with examples including Mark’s, Sport Chek, and Winners/Marshalls.
In select high-demand locations, the strategy extends further, with full reconfiguration of the space into smaller-format stores through the extension of internal mall corridors. This approach allows for a more granular merchandising mix and aligns with retailer demand for smaller footprints in dominant centres.
The shift reflects a broader move across the industry toward maximizing productivity per square foot while reducing reliance on single-anchor tenants.
Former Hudson’s Bay at Oshawa Centre. Photo: RI/Google
Rising Productivity and Leasing Demand Support Strategy
Primaris pointed to significant improvements in tenant performance across its portfolio as evidence that the repositioning strategy is already delivering results. Aggregate tenant sales have grown from approximately $1.7 billion in 2022 to $3.6 billion today, while average sales per square foot have increased from the low $500 range to more than $800.
At the same time, leasing activity has accelerated, with the REIT noting that its teams are operating at elevated levels to keep pace with demand. “Our leasing team has been operating at about 150 percent capacity,” Avery said, highlighting the intensity of activity across the portfolio.
The performance aligns with Primaris’ broader acquisition strategy, which has focused on dominant regional shopping centres. At Lime Ridge Mall in Hamilton, for example, tenant sales productivity was already exceeding $800 per square foot prior to its acquisition, reinforcing the REIT’s focus on high-performing assets.
Beyond Retail: Unlocking Value From Excess Land
In addition to repositioning existing retail space, Primaris is also advancing a longer-term strategy to unlock value from its underlying land holdings. The REIT controls approximately 1,400 acres of land across Canada, with an estimated 400 acres identified as excess to core mall operations.
These lands present opportunities for intensification, including the potential for additional retail, residential, or mixed-use development over time. While such projects are expected to unfold over a longer horizon, they represent a significant embedded value component within the portfolio.
Avery emphasized the strategic importance of these assets, noting that malls occupy large, centrally located parcels that are increasingly difficult to replicate. “Malls are fabulous real estate… nearly impossible to develop in built-up urban locations,” he said, pointing to the long-term scarcity value of these sites.
Orchard Park Centre in Kelowna BC. Photo: Primaris
A Structural Shift in Canadian Mall Strategy
Primaris’ repositioning strategy reflects a broader evolution in how shopping centre owners are managing their assets in a post-department store environment. Rather than viewing anchor closures as a loss, landlords are increasingly treating them as an opportunity to modernize their properties and improve overall performance.
While other major landlords, including Cadillac Fairview and Oxford Properties Group, have also advanced redevelopment and intensification strategies, Primaris’ current program highlights the extent to which the industry has shifted from reactive to proactive asset repositioning.
As outlined in the company’s annual meeting and analyst call, the transformation of large-format retail space is now central to the future of enclosed shopping centres in Canada. Former department store locations, once seen as essential anchors, are increasingly being reimagined as flexible, high-value components of a more diversified retail ecosystem.
Happy Belly Food Group Inc., a leader in acquiring and scaling emerging food brands across Canada, announced Tuesday it has signed as of May 4, a binding Letter of Intent agreement that will see a 50% acquisition of the Ghost Taco fast casual restaurant chain through the formation of a joint venture with optionality to acquire the remaining 50%.
“Ghost Taco is a fast-growing Ontario-based fast-casual restaurant brand specializing in bold, Mexican-inspired tacos, bowls, sides and desserts. Founded by Samantha and Grant Buckley as a pop-up, Ghost Taco has grown into a multi-location concept with a playful “unauthentic Mexican” positioning. The brand has built a loyal customer following through its distinctive flavors, strong local appeal and memorable brand identity, supported by a scalable franchise model and an expanding footprint across Ontario, including Newmarket, Toronto, Kingston, Whitby, Barrie, Peterborough and other markets. The acquisition supports our continued investment in differentiated, founder-led foodservice brands with strong unit economics and meaningful growth potential,” said Happy Belly in a news release.
The company said theacquisition represents the incorporation of Happy Belly’s 11th restaurant brand, 12th overall, and the first acquisition of 2026. Ghost Taco, an asset light franchised system, has six established real estate locations in Ontario.
Sean Black
“When looking for an acquisition we look for the 3 P’s: People, Product and Process. With co-founders Samantha and Grant Buckley of Ghost Taco, we found exactly that,” said Sean Black, Chief Executive Officer of Happy Belly.
“I have been looking for the right brand to get back into the Mexican-inspired category where I had previous success founding and growing Mucho Burrito to be the market leader in Canada for fast casual Mexican. It is going to be a lot of fun growing Ghost Taco into what we believe can be the next leader in fast casual Mexican in North America. I love working with founders and trying to help their emerging brands reach their full potential. Sam, Grant & Steve welcome to the Happy Belly family… I can’t wait to get started growing the business together.”
“In addition to meeting our criteria for people, product, and process, this acquisition aligns perfectly with the financial metrics and belly check criteria Happy Belly looks for in an acquisition, being debt free and cashflow positive. Once closed, this transaction will integrate into our accelerated M&A program, which includes 681 contractually committed locations across multiple emerging brands at various stages of development, construction, and operation. Our dual expansion strategy, combining franchised growth with targeted corporate store openings highlights our focus on disciplined, predictable growth as we advance toward becoming Canada’s leading restaurant consolidator.”
Happy Belly and Ghost Taco have signed a binding LOI agreement for the formation of a joint venture for the purposes of franchise expansion and growth of the Ghost Taco.
Happy Belly Food Group photo
“Our approach has always been to focus on the development and growth of emerging brands in the food sector. Ghost Taco will be an accretive acquisition by Happy Belly Food Group, and it is anticipated that our franchising program will deliver new franchised locations that will continue to drive both the top line and bottom line of the company,” added Black.
The company’s portfolio includes Heal Wellness, Rosie’s Burgers, Yolks Breakfast, Via Cibo Italian Street Food, iQ Food Co., and others.