
Canadian retail activity strengthened in June, with purchasing volumes rising faster than headline sales and several major categories ending the second quarter with improving momentum. This August 2026 edition of the Canadian Retail Monitor reviews the latest retail-related data released in August, which primarily covers June because Statistics Canada publishes these figures on a delayed schedule.
Retail sales reached $74.3 billion in June, up 0.6% from May and 5.2% from a year earlier, according to Statistics Canada. More significantly for underlying consumer demand, retail sales volumes increased 1.5% from May and 2.1% year over year.
The results show a market that remains highly uneven. Health and personal care, apparel and general merchandise generated substantial real growth, while food retail continued to weaken. Higher gasoline prices contributed heavily to the increase in headline retail dollars even as fuel volumes declined.
Retail Insider’s analysis of the April-to-June period also shows momentum improving in several discretionary categories as the second quarter progressed.
This Month’s Canadian Retail Analysis

Canadian Retail Dashboard
| Indicator | June 2026 | Change |
|---|---|---|
| Total retail sales | $74.3 billion | +0.6% MoM |
| Retail sales, year over year | — | +5.2% |
| Retail sales volume | — | +1.5% MoM |
| Retail volume, year over year | — | +2.1% |
| Core retail sales* | $47.0 billion | +1.2% MoM |
| Core retail, year over year | — | +3.9% |
| E-commerce sales | $5.73 billion | +9.9% MoM |
| E-commerce share of retail | 7.7% | May: 7.1% |
| All-items CPI | — | +2.8% YoY |
| July advance retail estimate | — | -0.8% MoM |
*Core retail excludes gasoline and fuel vendors and motor vehicle and parts dealers.
June capped a stronger second quarter. Retail sales increased 2.2% in Q2, while sales volumes rose 0.4%.
Real Retail Demand Strengthens
The gap between dollar sales and volumes is one of the most important signals in the June data.
Retail sales increased 0.6% from May, but volumes rose a much stronger 1.5%. That indicates the monthly improvement reflected greater purchasing activity rather than simply higher prices.
The year-over-year comparison is more mixed. Retail sales were 5.2% higher than in June 2025 while volumes increased 2.1%, leaving part of the headline growth attributable to prices.
Gasoline provides the clearest example. Sales at gasoline and fuel vendors were up 20.2% from a year earlier, while volumes fell 6.6%. Gasoline prices rose by a similar magnitude over the period.
The distinction matters commercially. Rising sales dollars do not necessarily indicate strengthening demand when prices are moving sharply higher.

What Drove Canada’s Retail Growth?
Canadian retail sales increased by approximately $3.7 billion between June 2025 and June 2026, with a relatively small number of categories accounting for much of the increase.
| Retail category | Approx. contribution to YoY retail growth |
|---|---|
| Gasoline and fuel | +1.76 percentage points |
| General merchandise | +1.39 pts |
| Health and personal care | +1.13 pts |
| Motor vehicles and parts | +1.00 pt |
| Sporting, hobby and miscellaneous | +0.42 pts |
| Clothing-related retail | +0.30 pts |
| Building materials and garden | -0.22 pts |
| Food and beverage | -0.25 pts |
| Furniture, home furnishings and electronics | -0.29 pts |
Gasoline accounted for a large share of nominal retail growth, but that contribution was overwhelmingly price-driven.
The picture changes considerably when volumes are examined. General merchandise and health and personal care were the largest contributors to real Canadian retail growth, while food and beverage retail and gasoline were the biggest drags.
That makes the underlying June story stronger than the headline sales figure alone suggests.
Retail Sector Pulse
Retail Insider maps Statistics Canada data to its own sector classifications to provide a consistent framework for the monthly Monitor and upcoming sector reports.
The RI classifications are analytical categories rather than official Statistics Canada definitions. Broader Statistics Canada industries are used as proxies where necessary.
| Retail Insider Sector | June Signal | Key Evidence |
|---|---|---|
| Health & Beauty | Strong | Health/personal care sales +13.5%; volume +12.7% |
| Apparel & Fashion | Improving | Clothing-related sales +5.4%; volume +6.6% |
| Department Stores & General Merchandise | Accelerating | Sales +9.6%; volume +10.0% |
| Grocery | Contracting | Food/beverage -1.3%; supermarket volume -4.5% |
| Home Furnishings | Stabilizing | Annual weakness continues, but recent sequential trend improved |
| Electronics & Appliances | Weak | Sales -11.1%; volume -9.9% |
| Jewelry & Watches | Strong | Jewellery/luggage/leather sales +21.8%; volume +30.1% |
| Sporting Goods & Outdoor | Positive | Sporting/hobby/misc. sales +7.1%; volume +5.7% |
| Automotive | Positive | Motor vehicles/parts +3.7%; volume +3.2% |
| Convenience Retail | Price-driven | Fuel spending surged while volumes declined |
| Food Service | Positive | Foodservice sales +6.0% YoY |
The signals are intended to identify direction rather than mechanically rank sectors. The classifications can become more precise as additional monthly observations accumulate.

Health & Beauty Maintains Strong Momentum
Health and personal care remained one of the strongest areas of Canadian retail in June.
Sales increased 13.5% year over year, while volumes rose 12.7%. Average sales during April through June were approximately 3.5% higher than during January through March, with real volumes also strengthening.
The relatively small difference between sales and volume growth indicates that the increase was primarily demand-driven rather than inflation-driven.
Broader retailer reporting provides some supporting context. Target said wellness-related categories generated double-digit first-quarter growth after it expanded the assortment, although its predominantly U.S. results are contextual rather than a proxy for Canadian performance.
The Canadian evidence itself is strong enough to classify Health & Beauty as one of the country’s leading retail sectors entering the second half of 2026.

Apparel & Fashion Enters Summer With Improving Demand
Canadian apparel-related retail strengthened as the second quarter progressed.
Sales at clothing, clothing accessories, shoes, jewellery, luggage and leather goods retailers increased 5.4% from June 2025, while volumes were 6.6% higher. Average current-dollar sales during April through June were approximately 2.7% above the January-to-March average.
Retailer results during the period point in the same general direction. Gap Inc. reported a 2% company-wide comparable-sales increase in its latest quarter, including a 10% increase at Gap, 2% at Banana Republic and 1% at Old Navy. Management identified strength in areas including denim and activewear, while Athleta and some seasonal categories remained weaker.
Canada Goose also reported apparel leading growth in its latest completed fiscal quarter as it expanded its seasonal product offering, although that reporting period largely preceded June.
The evidence supports an Improving assessment rather than a uniformly strong one. Performance remains uneven by retailer and product category, but Canadian apparel entered summer with stronger real demand than earlier in the year.
Department Stores & General Merchandise Accelerates
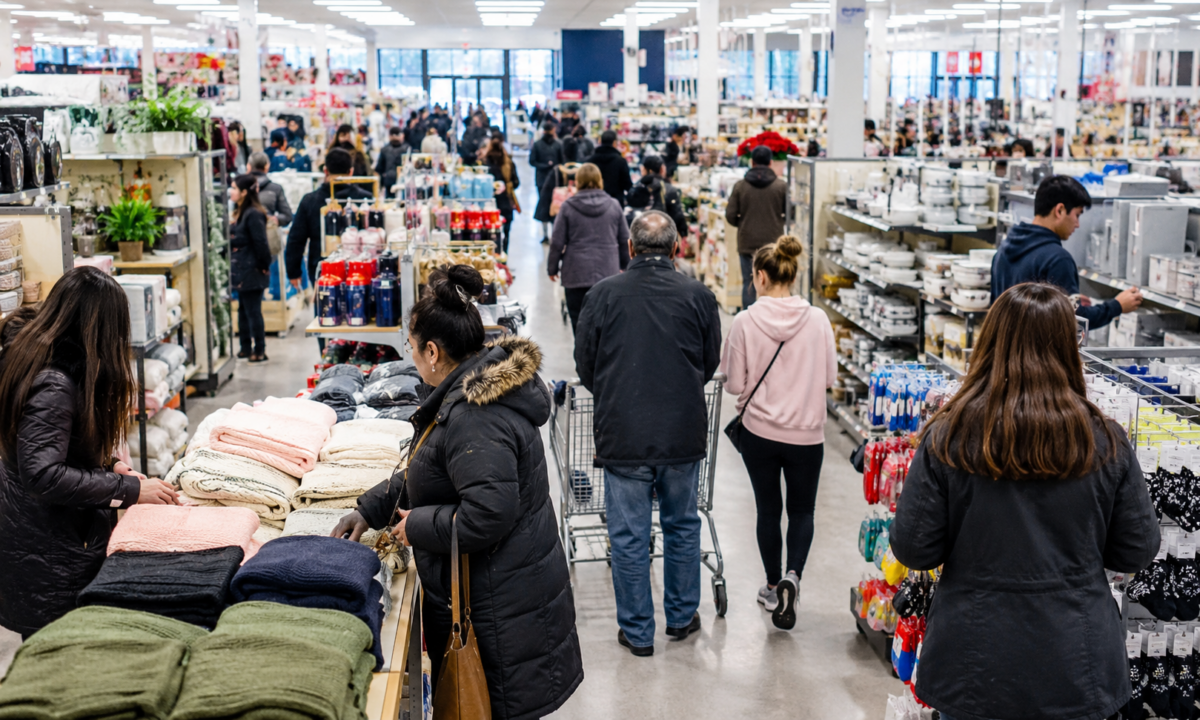
General merchandise was one of June’s standout categories.
Sales increased 2.7% from May and 9.6% from a year earlier, while volumes rose 10.0% year over year. The close relationship between nominal and real growth indicates that the increase was overwhelmingly driven by purchasing activity.
The monthly strength came after a comparatively subdued earlier part of the quarter, making June look more like a late-Q2 acceleration than a continuation of uniformly strong growth.
Canadian retailer evidence also points to strength in value-oriented formats. Dollarama reported 5.6% Canadian same-store sales growth in its latest quarter, supported by both traffic and basket growth. Management said affordability and everyday value remained important to consumers.
Dollarama’s results cannot explain the Statistics Canada increase directly, but they provide evidence that the country’s Discount and Value segments were seeing strong consumer engagement during the broader period.

Grocery Remains Under Pressure
Food retail was one of the weakest parts of the Canadian retail market in June.
Food and beverage retailer sales declined 1.3% from a year earlier, while volumes fell 4.5%. Supermarkets and other grocery retailers excluding convenience stores recorded sales down 1.1% and volumes down 4.5%.
The weakness extends beyond a single month. Average food and beverage retail sales during April through June were approximately 1.3% below the January-to-March average, while real volumes were roughly 1.8% lower.
Food purchased from stores was also 3.9% more expensive than a year earlier. Canadians therefore spent slightly less at supermarkets despite higher prices, while the quantity purchased fell much more sharply.
Individual grocers are not necessarily following the national aggregate.
Empire Company reported food sales growth of 2.1% and same-store sales growth of 1.4% in its latest fiscal quarter. Management emphasized promotions, own brands, value-sized products and discount formats while noting continued pressure on household budgets.
Loblaw has similarly pointed to traffic and market-share gains supported by value positioning, particularly through hard-discount banners.
The contrast is commercially significant. Industry-wide grocery volumes can decline while individual retailers grow through market-share gains, store expansion, format mix and stronger execution.
Canada’s grocery environment therefore looks like weak aggregate volume demand combined with continuing competitive share shifts.
Home Retail Remains Weak, With Signs of Stabilization
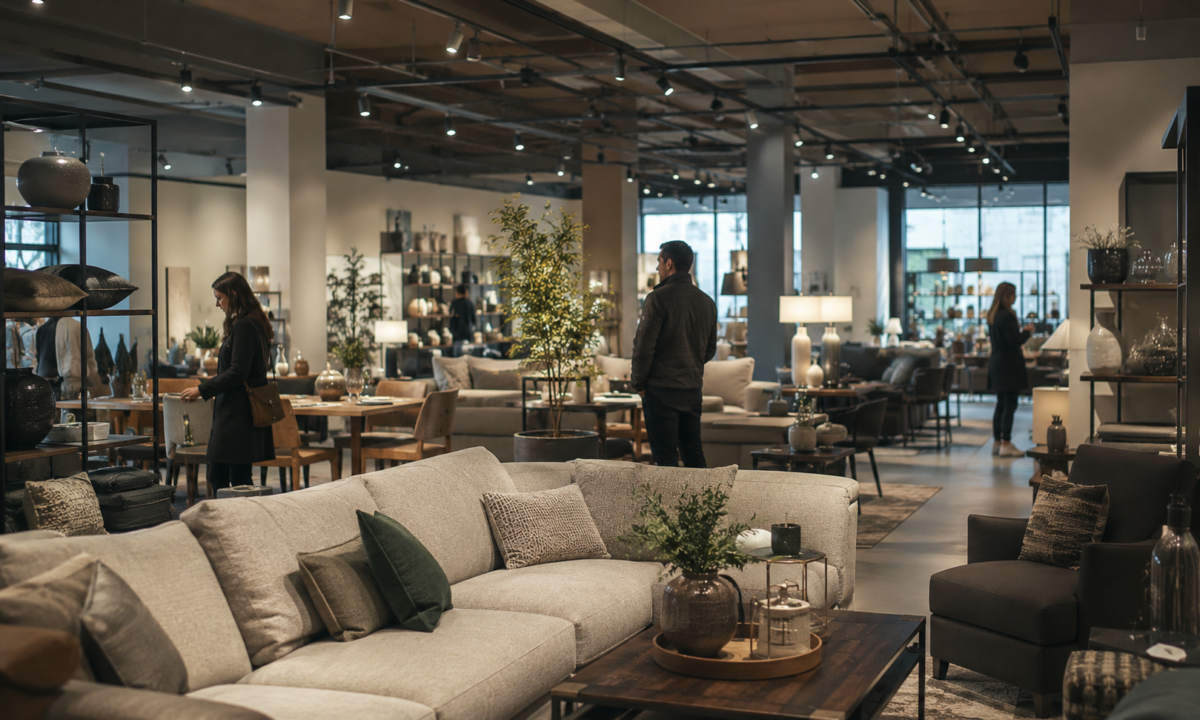
Home-related retail remained below year-earlier levels in June.
Sales at furniture, home furnishings, electronics and appliance retailers declined 5.6% year over year, while volumes fell 4.2%. Electronics and appliances were particularly weak, with sales down 11.1% and volumes down 9.9%.
Furniture performed considerably better. Current-dollar sales were approximately flat year over year while volumes increased 2.8%.
Recent sequential data also suggest the broader category may be stabilizing. Average second-quarter real volumes for furniture, home furnishings, electronics and appliances were approximately 1.6% above the first-quarter average, even though current-dollar sales were essentially unchanged.
Company performance shows how much conditions differ within the sector. Williams-Sonoma reported a 4.8% comparable-sales increase in its latest quarter, with every major brand positive. Management said it gained market share while the broader home furnishings market declined in the low single digits and identified Canada among its stronger international markets.
Best Buy reported a different pattern. Overall comparable sales increased 2%, supported by computing, gaming, mobile phones and newer technology categories, while appliances remained pressured. Management linked appliance weakness partly to the stagnant housing market and a highly competitive retail environment.
The evidence points to a weak aggregate market with substantial differences between categories and retailers. Retail Insider therefore assesses Home Furnishings as Stabilizing and Electronics & Appliances as Weak.

Canadian Retail Momentum
The Sector Pulse describes where categories stand today. The momentum measure answers a different question: is their direction improving or deteriorating?
Retail Insider compares the average seasonally adjusted sales level during April through June with the preceding January-to-March period.
| Category | 3-Month Sales Momentum | June YoY Sales | June YoY Volume | RI Assessment |
|---|---|---|---|---|
| Health & personal care | +3.5% | +13.5% | +12.7% | Strong |
| Clothing-related | +2.7% | +5.4% | +6.6% | Improving |
| Motor vehicles & parts | +2.6% | +3.7% | +3.2% | Positive |
| Total retail | +2.2% | +5.2% | +2.1% | Improving |
| Building materials & garden | +1.2% | -3.7% | -5.8% | Tentative improvement |
| Sporting/hobby/miscellaneous | +0.7% | +7.1% | +5.7% | Positive |
| General merchandise | +0.4% | +9.6% | +10.0% | Accelerating late in Q2 |
| Furniture/home/electronics | ~0.0% | -5.6% | -4.2% | Stabilizing |
| Food & beverage | -1.3% | -1.3% | -4.5% | Contracting |
| Gasoline & fuel | +12.0% | +20.2% | -6.6% | Price-driven |
Health and personal care shows sustained strength, while apparel improved through Q2. General merchandise’s modest three-month figure masks a much stronger finish in June.
Home retail remains weak against last year but is showing less sequential deterioration. Food retail remains the clearest area of persistent weakness.
Gasoline again demonstrates why dollar growth must be separated from demand. Average gasoline and fuel sales increased sharply between the first and second quarters while real volumes declined.
Market Segment Signals
Statistics Canada does not separate retail activity into Luxury, Premium, Mid-Market, Value, Discount or Off-Price segments. Company reporting can provide supporting signals where Canadian evidence is strong enough.
The clearest signal this month is Value and Discount.
Dollarama’s 5.6% Canadian same-store sales increase was supported by both traffic and basket growth. Empire continues to expand discount-oriented formats, while Loblaw has highlighted hard discount as an important source of traffic and market-share growth.
The evidence does not establish that Canadian consumers are universally trading down. It does show that value positioning remains commercially important across several large retail businesses.
Toronto Pulls Ahead of Vancouver
Geographic performance diverged considerably in June.
| Market | June Sales | MoM | YoY |
|---|---|---|---|
| Canada | $74.3B | +0.6% | +5.2% |
| Toronto | $13.0B | +3.9% | +6.6% |
| Montréal | $7.85B | +1.0% | +4.1% |
| Vancouver | $5.01B | -0.1% | -0.2% |
Toronto was the standout major metropolitan market, with sales increasing 3.9% from May and 6.6% from a year earlier. The result marked a sharp acceleration after a more uneven spring.
Montréal recorded moderate growth, with sales increasing 1.0% from May and 4.1% year over year.
Vancouver was considerably weaker. Sales edged down 0.1% from May and were 0.2% below June 2025 levels. Following a strong May increase, the result points to continued volatility rather than a steady downward trajectory.
Atlantic Canada Posts Strong Annual Growth
Several smaller markets recorded faster year-over-year growth than Canada’s largest provinces.
| Geography | MoM | YoY |
|---|---|---|
| Newfoundland and Labrador | +1.2% | +6.9% |
| Prince Edward Island | +1.3% | +10.6% |
| Nova Scotia | +0.9% | +8.0% |
| New Brunswick | -0.7% | +4.2% |
| Quebec | +0.5% | +4.5% |
| Ontario | +1.6% | +5.9% |
| Manitoba | +0.7% | +7.2% |
| Saskatchewan | -0.3% | +3.8% |
| Alberta | -1.3% | +7.4% |
| British Columbia | +0.1% | +1.7% |
| Yukon | -2.8% | +7.7% |
| Northwest Territories | -0.4% | -4.4% |
| Nunavut | +1.5% | +18.4% |
Prince Edward Island, Nova Scotia, Alberta and Manitoba all posted relatively strong annual growth, although smaller population bases can produce greater volatility.
Ontario also outperformed the national growth rate, helped by Toronto’s strong June. British Columbia remained one of the weaker large provincial markets.

Channel Monitor: E-Commerce Rebounds Sharply
Canadian retail e-commerce sales increased 9.9% from May to $5.73 billion in June.
Online sales represented 7.7% of total retail trade, compared with a revised 7.1% share in May. E-commerce sales were 18.7% higher than a year earlier.
The June increase is notable, but one month is insufficient to determine whether Canadian retail has entered a new phase of digital share growth.
Historical e-commerce estimates can also be revised materially. Statistics Canada revised May e-commerce sales upward in its subsequent release, reinforcing the importance of using the latest available series.
For now, June is best viewed as a notable e-commerce rebound that warrants monitoring rather than evidence of a structural step-change.

Restaurant Spending Outpaces Food Retail
Canadian spending at restaurants and other foodservice businesses continued to outperform grocery retail in June.
Seasonally adjusted foodservice and drinking-place sales reached approximately $8.85 billion, up 0.5% from May and 6.0% from a year earlier. Full-service restaurant sales increased 6.7% year over year, while limited-service sales rose 6.1%.
Restaurant prices increased 2.7% over the same period, below the rate of foodservice sales growth.
At supermarkets, the pattern was very different. Sales declined 1.1% year over year and volumes fell 4.5%, while food purchased from stores was 3.9% more expensive.
June also coincided with FIFA World Cup activity in Toronto and Vancouver. Statistics Canada specifically referenced the tournament when discussing June conditions, making it relevant contextual evidence for the month. Drinking-place sales increased 2.7% from May to their highest level since January 2023.
The comparison does not establish that consumers directly shifted spending from grocery stores to restaurants. It does show that restaurant spending substantially outperformed grocery retail during June.
What Canadians Were Buying
Statistics Canada’s Retail Commodity Survey provides another view of consumer spending by tracking products sold rather than the industries selling them.
The latest available commodity figures cover May and are not seasonally adjusted, so they are best used as supporting evidence rather than compared directly with June retail-industry data.
Total retail commodity sales reached $79.9 billion in May, up 4.0% from a year earlier. Home health products increased 11.2%, sporting and leisure products rose 6.0%, infant care, personal and beauty products increased 4.2%, and food and beverages were up 3.1%.
Home furniture, furnishings, housewares, appliances and electronics declined 2.5%. Footwear fell 0.6%, hardware, tools, renovation and lawn-and-garden products declined 2.4%, and audio, video and game software sales were down 22.0%.
The commodity figures broadly reinforce the wider Monitor: health-related spending remains strong, sporting and leisure demand is positive, while several housing-related categories continue to face pressure.
Inflation Adds Context to Retail Performance
Canada’s all-items Consumer Price Index (CPI) increased 2.8% year over year in June, easing from 3.2% in May.
| Consumer Price Index category | June YoY |
|---|---|
| All items | +2.8% |
| Food | +3.5% |
| Food purchased from stores | +3.9% |
| Clothing & footwear | +1.5% |
| Household operations/furnishings/equipment | -0.2% |
| Health & personal care | +2.5% |
| Gasoline | +20.5% |
| Goods overall | +3.5% |
| Services | +2.2% |
CPI categories and retail-industry categories cover different baskets and are not directly equivalent. They are nevertheless useful for determining whether sales growth appears primarily demand-driven or price-driven.
Health and personal care provides one of the clearest examples of real growth. Retail sales increased 13.5% and volumes 12.7%.
Gasoline presents the opposite case. Spending increased 20.2% while volumes declined 6.6%, alongside a 20.5% increase in gasoline prices.
What to Watch in July
Statistics Canada’s advance estimate suggests retail sales declined approximately 0.8% in July.
The estimate is preliminary and based on responses representing 56.5% of companies surveyed, well below the response rate for finalized monthly retail data. It should therefore be treated as directional.
The July results will help determine whether June’s late-quarter acceleration in general merchandise persisted, whether apparel maintained its improving momentum, whether Home Furnishings continued to stabilize and whether grocery volumes remained under pressure.
They will also show whether June’s sharp e-commerce rebound carried into the summer or proved temporary.
Retail Insider Takeaway
June ended the second quarter on a relatively encouraging note for Canadian retail.
Headline sales increased, but the stronger signal was the 1.5% monthly rise in sales volumes. General merchandise and health and personal care were the largest drivers of real retail growth, while apparel entered summer with improving momentum.
The market remains divided. Food retail volumes continued to contract, Electronics & Appliances remained weak, and gasoline generated substantial sales-dollar growth without corresponding demand growth.
Retailer evidence also shows why aggregate statistics require additional interpretation. Canadian grocers can gain share while overall grocery volumes fall. Selected home retailers can grow in a contracting market. Discount operators can attract stronger traffic even while consumers remain cautious about household spending.
For Retail Insider’s sector outlook, Health & Beauty remains Strong, Apparel & Fashion is Improving, Department Stores & General Merchandise accelerated into the end of Q2, Grocery remains under volume pressure, Home Furnishings shows tentative stabilization, and Electronics & Appliances remains challenged.
The preliminary July estimate suggests Canada’s retail environment remained uneven entering the second half of 2026.