Retail learned a hard lesson over the past decade. The companies that won were not always the ones with the most data or the flashiest algorithms. They were the ones who could trust their own numbers, explain how a recommendation was made, and stand behind it when a regulator or a customer asked.
Healthcare is now living through the same reckoning, and the parallels are worth a retail leader’s attention.
The setup is familiar
In retail, the temptation was always to optimize for the short-term number: push the sale, chase the conversion, let the model run. The brands that did this without guardrails ended up with messy data, decisions no one could explain, and trust problems that cost more to fix than they ever saved.
In healthcare, the equivalent number is the risk score. Private insurers covering older Americans get paid more for sicker patients, so there has always been pressure to find and report every possible condition. For years, the tools built for this job were optimized to do one thing: add more.
The reckoning arrives
In 2026, federal auditors reviewed a set of these insurers and found that 80 to 91 percent of the diagnoses they sampled were not fully supported by the patient record. A federal advisory panel told Congress the broader pattern adds up to roughly 22 billion dollars in excess payments a year. One major insurer paid 117.7 million dollars to settle claims tied to a system that only ever added conditions and never removed the ones that did not hold up.
Any retail executive who lived through an audit of their own data practices will recognize the shape of this. A tool optimized for one direction, with no check on quality, eventually meets someone asking to see the receipts.
The shift in what buyers want
The interesting part is how fast the buying criteria changed. Healthcare organizations used to evaluate risk adjustment software on a single question: how much additional revenue will this find? Now the first questions are different. Can it show why it suggested a diagnosis? Can it remove a code that is no longer valid, not just add one? Will the evidence trail survive an audit?
This is the same maturity curve retail walked. The market stopped rewarding tools that simply maximized a number and started rewarding tools that could be trusted, explained, and defended. Governance moved from a nice-to-have to the first item on the checklist.
Why explainability becomes the product
The healthcare tools gaining ground now are built on what is called Neuro-Symbolic AI, an approach that pairs pattern recognition with explicit rules. In plain terms, it does not just guess. It links every suggestion to a specific piece of evidence and shows the logic, so a human can check it and an auditor can follow it.
Retail leaders already know why this matters. Once a model touches money and trust, opaque automation becomes a liability, not an asset. The winning systems are the ones where a person stays in the loop and every decision has a paper trail.
The lesson, stated plainly
Every data-heavy industry eventually reaches the same fork. One path optimizes a number until someone forces a reckoning. The other builds for accuracy and transparency from the start, and treats the audit not as a threat but as a test it is ready to pass.
Retail has mostly chosen the second path, the hard way. Healthcare is choosing it now, under real regulatory pressure. For any leader watching from another sector, the takeaway is the same: the tools worth buying are the ones that can show their work.
Financial technology company SumUp has launched its payment services in Canada, marking its entry into its 38th market as it expands its North American operations with products aimed at small businesses.
The company said the Canadian rollout includes the introduction of its SumUp Go card reader and Payment Links platform, allowing merchants to accept both in-person and remote payments. The launch is part of the company’s broader expansion across the Americas and targets Canada’s more than one million employer businesses, the majority of which are classified as small businesses.
The move gives SumUp a foothold in the Canadian payments market as it seeks to compete by offering payment processing tools without monthly fixed fees and with a pay-as-you-go pricing model. The company said it plans to build its Canadian product lineup over time based on feedback from local merchants.
“Launching in Canada is a natural next step in SumUp’s growth across North America”, said Andrew Helms, CEO of SumUp North America. “Canada has an incredibly vibrant small business community and we see a huge opportunity to give these merchants the tools they need to thrive, without the complexity or hidden costs they have come to expect from legacy providers. At SumUp, we’re in it for the merchant. When they succeed, we succeed.”
As part of its Canadian launch, SumUp is introducing two payment products.
SumUp Go is a portable card reader designed to allow merchants to process in-person payments. The company said the device requires no monthly fixed costs or complex setup, allowing businesses to begin accepting payments immediately.
Payment Links enables merchants to accept remote payments without additional hardware by generating secure payment links that can be shared through text message, email or social media.
SumUp photo
The company said the products are intended to provide businesses with a single payment system that supports both in-person and remote transactions.
SumUp said it developed its products using feedback from merchants and will continue expanding its Canadian offerings based on customer demand. The company said it is initially focusing on payment tools that allow businesses to begin accepting payments quickly and with minimal setup.
Andrew Helms
According to figures cited in the announcement, Canada had 1.10 million employer businesses as of December 2024, with 98.2 per cent classified as small businesses.
The company also pointed to expectations for continued growth in Canada’s payments sector, citing forecasts that the market will expand through 2031 as digital payment adoption increases and businesses seek payment systems that fit their operations.
Canadian merchants will be able to purchase the company’s products and register for its services directly through SumUp’s Canadian website.
Founded in 2012, SumUp said it serves more than four million small merchants across 38 markets. In Canada, the company said its initial offering will focus on in-person and remote payment acceptance through its payment terminal and digital payment tools.
Selecting a new electronic health record system is a major financial decision. Healthcare executives often ask how much does Epic EMR cost before making commitments. The initial vendor quote rarely reflects the true total investment required for long-term success. A realistic budget must include software licenses, complex implementation schedules, third-party integrations, and internal labor. Many systems experience unexpected overruns because they ignore these essential components. Knowing how much does it cost to implement Epic in a hospital helps leaders avoid costly planning mistakes. This practical guide breaks down the actual cost categories, hidden software expenses, and real return on investment for modern medical networks.
Why Epic EMR Pricing Is Difficult to Estimate Upfront
Software pricing in healthcare is rarely transparent. Epic systems does not publish a standard price sheet for its software suites. Instead, every sales contract is custom built around the specific profile of the purchasing organization. The final Epic cost depends heavily on overall institutional scale and clinical scope. Small independent practices, mid-sized regional clinics, and massive multi-state hospital systems face entirely different financial realities.
A custom quote accounts for your exact user count and chosen specialty modules. A pediatric hospital requires different modules than a cardiac care facility. Your deployment model shifts the numbers significantly. On-premise hosting requires heavy upfront hardware purchases. Cloud deployments change these capital expenses into predictable operating fees. These distinct variables make generic estimates useless. Industry surveys show that initial estimates can vary by millions of dollars. Understanding tailored Epic pricing models is critical during early procurement phases. Organizations must evaluate their baseline configuration needs and ongoing technical support requirements carefully. Miscalculating these initial parameters directly impacts the total Epic EMR pricing schedule over a multi-year lifecycle. This variation makes careful pre-planning an absolute necessity for chief financial officers.
How Much Does Epic EMR Cost in 2026?
Predicting healthcare technology budgets requires analyzing multiple operational layers. Total expenditure is never a single line item. In 2026, the baseline Epic EMR cost for a medium-sized hospital system typically starts around 20 million dollars and can exceed 100 million dollars for large academic medical centers. Recent industry data shows that implementation services frequently cost triple the price of the software license itself. Decision-makers must look at specific operational drivers to understand how much does Epic cost for their teams.
Several core factors shape the final financial commitment. Here is the breakdown of the primary elements driving your Epic EHR cost:
Total concurrent user count and active practitioner licenses.
Selected clinical modules and specialized department features.
Hosting infrastructure choices including secure cloud environments.
Data migration complexity from legacy databases.
Staff training timelines and ongoing post-launch technical support.
A single facility might spend less on hardware but more on specialized clinical integrations. Large systems must scale these factors across dozens of clinics. Managing these variables determines whether your project stays within its original financial boundaries. A proactive approach to these baseline factors keeps long-term operational budgets stable. Hospital administrators should review these categories prior to starting contract negotiations.
Licensing, Implementation, and Subscription Models
Software acquisition models dictate your cash flow constraints. Some organizations choose traditional upfront licensing structures. Others prefer modern, cloud-based subscription models. The total Epic software cost involves more than just buying access permissions. Implementation services consume a massive portion of the initial launch fund. Certified consultants charge high hourly rates to configure the platform to your specific medical workflows. These professional services frequently equal or exceed the software license fees. Long-term maintenance agreements add another recurring layer to the cost of Epic. Upgrades happen frequently in healthcare IT. Your contract must clarify who pays for regular system optimization. Understanding these Epic EHR pricing models protects healthcare systems from sudden mid-project budget shortfalls.
Organization Size and Workflow Complexity
Large medical networks present unique technical challenges. A system with multiple locations multiplies configuration demands. Each clinic might have distinct patient intake procedures. Because of this, executives want to know how much does Epic EHR cost when scaling across diverse networks. Specialized clinical workflows require precise customization. An oncology unit needs different documentation pathways than an emergency room.
Building these custom pathways takes time and specialized talent. More configurations mean longer project timelines. Extended timelines raise the overall cost of Epic EHR rapidly. Change management is another major factor. Training thousands of nurses and doctors requires significant internal coordination. Large hospitals must hire temporary staff to maintain care quality during training weeks. This makes workflow complexity a dominant driver of total software expenditures.
Hidden Epic EMR Expenses Healthcare Teams Often Miss
Unseen costs can quickly ruin a well-planned financial strategy. Healthcare networks routinely underestimate the effort required to clean legacy data. Migrating corrupted or poorly formatted patient files into a new system creates immediate technical errors. Rectifying these database issues requires expensive data experts. Third-party integrations also inflate Epic EHR costs unexpectedly. Your new platform must communicate seamlessly with existing laboratory systems, imaging networks, and medical devices. Each custom interface requires dedicated development and rigorous testing.
Security compliance adds another financial layer. Independent cybersecurity firms must audit the entire infrastructure before launch. Staff downtime during the transition phase creates a measurable drop in clinical productivity. Doctors see fewer patients while learning the new interface. This temporary revenue reduction is a real expense.
Organizations also face ongoing expenses for custom reporting setup. Government regulations require precise data reporting. Building these analytics dashboards requires specialized database engineers. Post-launch optimization adds to the overall Epic EHR price. The system will need adjustments after six months of live clinical use. Neglecting these items causes severe budget overruns. Leaders must budget for the Epic medical records cost with these long-term operational realities in mind. Ignoring these extra expenses frequently results in significant emergency board reviews.
How to Evaluate Epic EMR ROI Beyond the Initial Price
Measuring the value of modern healthcare software requires looking past initial procurement expenses. True return on investment develops over years of steady clinical use. Operational efficiency improves when repetitive manual tasks disappear. Doctors spend less time clicking through menus and more time with patients. Streamlined documentation reduces charting errors significantly. This improvement accelerates billing cycles and minimizes costly insurance claim denials. Recent studies show hospitals can recover up to 3 percent of leaked revenue through better coding accuracy.
Better data access transforms clinical outcomes. Fast retrieval of patient histories saves valuable time during medical emergencies. A unified portal enhances the patient experience by simplifying appointment scheduling and billing updates. However, achieving these financial and clinical gains is not automatic. The final calculation depends on user adoption rates. If staff members resist the new workflows, efficiency drops. Poor integration quality can also limit your financial returns. Leaders must track specific metrics like time-to-chart and billing lag to evaluate the Epic EMR price accurately. Investing in a comprehensive Epic electronic health record cost structure only pays off when the entire clinical team embraces the platform fully. Regular internal audits help verify these efficiency improvements over time.
How Healthcare Organizations Can Plan a More Realistic Epic Budget
Successful deployment requires a thorough assessment of your current technical state. Teams must map existing clinical workflows before speaking with software vendors. Defining precise implementation goals prevents scope creep during the development phase. An extensive audit of legacy systems reveals exactly which data needs migration. This step helps estimate integration costs accurately.
Involving clinical users early in the planning stage ensures the system meets actual frontline needs. Doctors and nurses provide invaluable insights into workflow bottlenecks. Their feedback prevents expensive post-launch reconfigurations. Organizations must also allocate funds for long-term technical support and regular system updates. Treat this process as a continuous strategic investment rather than a one-time software purchase.
Managing medical technology costs requires rigorous planning and clear financial expectations. Executives must understand the complete financial picture before signing agreements. Knowing exactly how much does Epic EMR cost across its entire operational lifecycle empowers leaders to make sustainable financial choices for their communities. Preparing your team for these adjustments yields a more predictable deployment experience.
Luxury brands continue to prioritize strategic brick-and-mortar openings despite broader retail uncertainty. Store launches in premier shopping districts reflect deliberate decisions on site selection, store format, and experiential design. These trends directly shape industry direction and the shopping experiences of clientele.
The growing importance of physical retail for luxury labels is altering high-end shopping environments. While digital commerce expands, the renewed focus on flagship locations underscores the ongoing significance of curated spaces in maintaining exclusivity and a strong brand narrative. For those monitoring luxury retail strategies, digital entertainment platforms such as online slots casino real money offer a relevant point of comparison on how in-person store environments complement online interactions, further supporting brand loyalty. The evolving store landscape reflects operational priorities as well as aspirational customer experiences within luxury fashion.
Market drivers sustaining new flagship openings
Physical stores provide tangible opportunities for luxury brands to manage every aspect of the customer journey. You see this through the emphasis on personal service, immersive product storytelling, and attention to detail that digital-only channels struggle to deliver. Storefronts reinforce brand prestige, supporting visibility and desirability among loyal clients and potential new customers.
Despite volatility in global retail, luxury store openings remain long-term strategic investments. They signal confidence in ongoing demand from affluent customers who continue to value in-person shopping. By establishing showpiece locations in sought-after districts, brands anchor their presence and create distinctive, memorable experiences for shoppers.
Geographic preferences and clustering patterns emerging
Openings typically favor renowned luxury corridors attracting high-net-worth individuals and tourists. These districts foster proximity to established peers, driving a mutually reinforcing dynamic among premium brands. Dense luxury clusters make it easier for customers to visit multiple leading stores in a single trip, reinforcing district appeal.
Malls featuring curated tenant mixes, ample spaces, and robust security continue to attract luxury retailers seeking stable, affluent footfall. High-profile shopping avenues with reliable infrastructure also boost the strategic value of each store opening in these destinations.
Changing store concepts and a focus on experience
Many new luxury outlets adopt larger footprints to accommodate flexible interiors and private client spaces rather than relying on a network of smaller boutiques. Within these updated formats, you will find integrated personalization zones, exhibition areas, and lounges designed to increase visit duration and deepen brand engagement. Retailers are striving for layouts that offer high visibility and adaptability to evolving customer expectations and product developments.
Experience-led design has become a standard for luxury openings. VIP salons and appointment-driven programming add exclusivity, while leaner inventory models make use of regional logistics capabilities. The interaction between digital platforms and in-store experiences demonstrates how omnichannel strategies underpin brand consistency and customer retention across the luxury fashion sector.
Most retailers spend weeks comparing CRM and ERP platforms. Feature lists, pricing tiers, integration logos on a vendor’s homepage. Then they hand the actual rollout to whichever implementation partner sent back the fastest quote, and ask the same handful of safe questions every buying guide recommends: how long will this take, will you train our staff, can you migrate our data.
Those questions matter. They are also not the ones that predict whether a project quietly blows its budget, or limps along half-broken for years. The real damage tends to come from the questions nobody thinks to ask in the sales meeting, the ones that only surface once the contract is signed and the discount is gone.
Research from Johnny Grow put the CRM implementation failure rate at 55% in 2025, measured against whether projects met their original business objectives. Gartner and Forrester have reported figures ranging from 30% to 70% over the years. On the ERP side, Panorama Consulting’s data shows a mid-size implementation now averages $7.1 million and 17.4 months, running 3.6 months past plan, with only 61% of projects meeting their stated objectives according to Mint Jutras. None of those dollar figures describe a typical independent Canadian retailer’s budget, but the pattern underneath them does. This is for any retailer about to sign a CRM or ERP contract who wants the version of this checklist nobody hands them across the table.
Why Most CRM and ERP Failures Have Nothing to Do With the Software
Gartner names poor data quality as the leading cause of CRM failure, and Panorama Consulting’s research shows 62% of organizations cite data migration as their single biggest implementation challenge. A CFIB report co-sponsored by Payworks and Sage found that 92% of Canadian small businesses use some form of digital tool, yet fewer than one in ten have fully integrated those tools across operations. The businesses that did see real returns averaged $1.60 back for every $1 invested, climbing to $2.40 for those with full integration. The upside is real. Most of it gets lost somewhere between buying the software and actually running on it, and that gap is decided by the questions below, not the platform itself.
The Baseline Questions Worth Asking Anyway
These show up in most CRM and ERP buying guides, and they’re worth asking even though they rarely decide the outcome on their own:
Scoping: How will you map our current workflows before configuring anything?
Data migration: What connects natively, and what needs custom integration work?
Customization: Are you customizing the platform, or configuring its standard settings?
Timeline and cost: What’s included in this quote, and what’s the process if scope shifts?
Training: How will staff at the store level get trained, not just head office?
Post-launch support: Who do we call when something breaks, and can this scale with us?
Useful answers here filter out the obviously unprepared vendors. They don’t filter out the ones who sound great in the room and still cause a slow, expensive failure six months in. That’s what the next set of questions is for.
The Questions That Actually Get Skipped
“Who owns our data once this contract ends?” Almost nobody asks this until they try to leave. Export formats can be unusable without paid help, and some vendors keep custom fields and configurations locked inside their own proprietary structure. Get the exit terms in writing before you sign, not during a renewal dispute three years later.
“What happens to open orders and in-progress purchase orders during the cutover weekend?” Migrating data is one project. Migrating a running business mid-transaction is another. Without a clear answer, retailers risk lost orders, double-shipped inventory, or a weekend spent manually reconciling whatever the new system can’t explain.
“Will the senior person in this meeting actually build our system, or does it get handed off after we sign?” This is one of the most common and least-discussed problems in implementation work. The experienced consultant runs the sales pitch, then a junior team executes the build. Ask for the names and track record of whoever will actually touch the configuration.
“How will this be tested against our real edge cases, not just a clean demo?” Returns processed against a promotional price, a gift card redeemed across two locations, loyalty points reconciling across online and in-store. Happy-path demos look great and reveal almost nothing. The breaks show up exactly where retail gets messy.
“Is the support rate after go-live the same as the implementation rate?” Implementation quotes are often priced aggressively to win the deal. The calls that come in month four, once a business is fully dependent on the system, can run at a meaningfully higher hourly rate. Get this number in writing, not as a verbal reassurance.
“Will we run the old and new systems in parallel, and who’s responsible for catching discrepancies during that window?” Without a defined owner, small data drift between systems goes unnoticed for weeks, by which point it’s tangled into live customer and inventory records that are far harder to untangle.
“Can we talk to a client who’s been live on this for at least a year, not someone who just launched?” Early references are reliably glowing, because the honeymoon period hasn’t ended. A retailer twelve months in, past the renewal point, tells a sales call never will.
Choosing Between Platforms Matters Less Than Choosing the Right Partner
Zoho’s appeal for small and mid-size retailers comes from its breadth: CRM, inventory, accounting, and e-commerce modules inside one connected ecosystem, useful for a multi-location retailer trying to avoid yet another disconnected tool. The tradeoff is that deeper retail-specific workflows sometimes need add-ons or a specialized partner to configure properly. NetSuite leans the other way, offering a more native, deeply built-out ERP for inventory-heavy retailers scaling fast across channels, at the cost of a higher price tag and a longer runway to get live. HubSpot stays strong on the customer-facing side, marketing, service, CRM, but thin on inventory and back-office operations, which usually means pairing it with a separate system.
Whoever does the actual configuration work, whether that’s an in-house IT lead, a Zoho implementation consultant, or a certified NetSuite partner, the platform is rarely what separates a smooth rollout from a stalled one. The seven questions above are.
What This Actually Means for Your Next Rollout
A KPMG survey found 81% of Canadian retail executives believe they need to invest in generative AI just to stay competitive, and that push, demand forecasting, personalization, smarter recommendations, runs entirely on the same customer and inventory data sitting inside a CRM or ERP system today. AI tools are only as useful as the data feeding them, and that data quality gets decided at implementation, long before any AI feature gets switched on.
The platform comparison is worth doing. It just isn’t where most projects actually go wrong. The retailers who get this right tend to be the ones who asked the uncomfortable questions before signing, and held out for specific answers instead of confident ones.
Consumer interest in sustainable beauty products continues to outpace purchasing behaviour, according to new research from product testing and consumer insights firm Curion, which says concerns over performance, confusing product claims, price and environmental impact remain the biggest barriers to adoption.
The company said its findings draw on its consumer database and identify four recurring challenges that continue to prevent environmentally conscious shoppers from consistently purchasing sustainable beauty products, despite growing interest in doing so.
Curion said the research found consumers closely associate natural ingredients with sustainability, but are more likely to see those ingredients as providing personal benefits rather than environmental ones. It also found many shoppers view sustainable purchasing as an aspiration rather than a practical reality because of cost, uncertainty and product expectations.
The company said the findings have implications for how beauty brands develop, test and communicate products, arguing that addressing those concerns requires product validation and clearer communication rather than additional marketing claims.
“Consumers aren’t rejecting sustainable beauty — they’re struggling to trust it,” said Cris Stroever, Director, Strategic Product Insights at Curion. “Our research shows the intent is there, but it keeps running into the same walls: Will it actually work? What do these labels even mean? Why does it cost more? Brands tend to treat these as messaging problems, when they’re really product and validation problems. Putting real products in front of real consumers, in the context they’ll actually be used, is how brands turn good intentions into repeat purchases.”
Curion divided its findings into four consumer dilemmas that it said affect purchasing decisions and product development.
The first is product performance. According to the research, consumers are unlikely to continue buying products they perceive as more sustainable if they do not perform as expected, regardless of environmental benefits. The company said some natural formulations behave differently from conventional products and may require an adjustment period, while noting that testing products in real-world settings can help brands evaluate performance and address consumer concerns.
The second challenge is product terminology. Curion said consumers remain confused by eco-labels, ingredient lists and environmental claims, with familiar plant-based ingredients generally viewed more favourably than unfamiliar chemical names or lengthy ingredient lists. The company said focus groups can help brands assess whether product labels and certifications are understood before products reach store shelves.
Tima Miroshnichenko photo
Price represents a third obstacle, according to the research. Curion said sustainable beauty products are widely perceived as carrying higher prices, reflecting the higher costs of some natural ingredients and environmentally focused packaging. The company said consumer feedback can help businesses communicate product value and refine pricing strategies to improve accessibility.
The fourth challenge involves environmental impact. Curion said many consumers experience anxiety or guilt about the environmental footprint of their beauty routines and often lack information about how to dispose of products sustainably. The company said greater transparency around sourcing, packaging and waste reduction, along with involving consumers earlier in product development, could help address those concerns.
Beyond those four issues, Curion said several trends continue to shape the sustainable beauty market, including refillable and reusable packaging, biodegradable and waterless formulations, increased attention to supply-chain transparency and continued development of plant-based and natural ingredients.
Orchard Park Centre in Kelowna BC. Photo: Primaris
For years, Primaris REIT‘s shopping centres have sat on significant amounts of land beyond their retail footprints. Much of that land remained constrained by legacy agreements, parking requirements and development restrictions, limiting what could be done with sites surrounding some of Canada’s most productive malls.
The collapse of Hudson’s Bay and the arrival of Chief Investment Officer Julian Schonfeldt have created a catalyst for change.
Schonfeldt, who joined Primaris earlier this year after serving as Chief Investment Officer at CAPREIT, has been tasked with identifying ways to unlock value from excess lands across the company’s national portfolio while maintaining a focus on operating dominant regional shopping centres.
“It’s a big mandate,” Schonfeldt said during an interview with Retail Insider.
Julian Schonfeldt
Primaris owns 25 shopping centres representing more than 1,200 acres of land. While much of that acreage remains essential to mall operations, Schonfeldt estimates that roughly 10 per cent could potentially be severed, rezoned and sold for alternative uses.
“In our portfolio of over twelve hundred acres, we believe that about ten per cent of that could be severed and rezoned and sold to developers,” he said.
The potential value is substantial. In a recent update to investors, Primaris estimated that its excess lands could represent between $275 million and $375 million in value, underscoring the significance of the initiative and management’s focus on identifying opportunities across its portfolio.
The initiative marks a new phase for Primaris. Over the past several years, the company has transformed its portfolio through acquisitions, adding major regional shopping centres across the country. Now, management is increasingly looking within its existing portfolio to identify additional sources of value.
“We just recently hired Julian Schonfeldt from CAPREIT as our CIO,” Primaris CEO Alex Avery previously told Retail Insider. “The first big project that we put him on was to explore our portfolio and find opportunities to surface value from these excess lands.”
A Portfolio Built for Opportunity
Primaris controls one of Canada’s largest enclosed mall portfolios, with properties located in major urban centres and regional markets across the country. Many of those assets occupy large sites acquired decades ago when land was more readily available and development patterns were different.
According to Schonfeldt, the typical Primaris mall occupies approximately 50 acres, with retail buildings often covering only about one-third of the site. The balance consists largely of parking fields, access roads and supporting infrastructure.
While not all of that land can be repurposed, Primaris believes there are meaningful opportunities across the portfolio.
Some sites face servicing constraints, access issues or lease restrictions. Others contain parcels that could potentially be separated from the shopping centre and repositioned for other uses without affecting retail operations.
“We have over a hundred acres that we can sell relatively cleanly,” Schonfeldt said.
Halifax Shopping Centre. Photo: Primaris REIT
Hudson’s Bay Helped Change the Equation
Although Primaris had been evaluating excess land opportunities before Hudson’s Bay’s collapse, the department store’s exit has helped accelerate the process.
For decades, many Hudson’s Bay leases contained provisions that restricted development on portions of shopping centre properties. Those restrictions often extended beyond the department store itself and affected adjacent parking areas and potential development sites.
“HBC had quite a bit of restrictions that constrained our ability to action some of the parking lands,” Schonfeldt said.
With many of those restrictions now removed, Primaris has more flexibility to evaluate opportunities that previously would have been difficult to pursue.
Avery has described the impact as significant. He noted that Primaris previously disclosed 71 acres that were directly affected by no-build restrictions, though the practical impact extended well beyond that acreage because of how those restrictions shaped site planning and development options.
The result is that land which may have been difficult to monetize in the past can now be examined through a different lens.
“The bankruptcy of HBC coincides with my joining the company, and my prior work experience really lends itself to this project of monetizing these land dispositions,” Schonfeldt said.
Looking Beyond Residential Development
While residential development often dominates conversations around shopping centre intensification, Schonfeldt said Primaris is evaluating a much broader range of opportunities.
The company is examining potential uses including seniors housing, hotels, self-storage facilities, student housing and workforce housing.
Every market presents different opportunities.
Toronto’s condominium market remains challenged, while other markets may be experiencing stronger development conditions. Some sites may be attractive to hotel developers. Others may be better suited to seniors housing or student accommodation.
“Every city has its own story. Every neighbourhood has its own story,” Schonfeldt said.
He pointed to seniors housing as an area generating particular interest.
“We’re also looking at seniors housing, which has quite a bit more momentum in the space right now. Our malls lend themselves very well towards that use.”
The accessibility of many shopping centres creates natural advantages for those uses. Many Primaris properties are located near transit routes, major roads and established residential communities while offering immediate access to retail services and amenities.
The company is also exploring opportunities that could deliver broader community benefits.
“If we can do something where we get the benefit of monetizing or surfacing some of this land value, but also giving something back to the community, that’s a very ideal usage for us,” Schonfeldt said.
Southgate Centre in Edmonton. Photo: Primaris REIT
A Different Strategy Than Many Mall Owners
Perhaps the most surprising aspect of Primaris’ approach is what the company does not plan to do.
Across Canada, many shopping centre owners have pursued large-scale mixed-use developments, often involving residential towers, joint ventures and multi-phase master plans spanning decades.
Primaris is taking a different path.
Schonfeldt said the company does not intend to become a residential developer. Instead, Primaris plans to identify parcels that can be severed and sold to developers, generating capital that can be reinvested into the core shopping centre business.
“This is strictly about severing and selling the land for cash,” he said. “It’s a way of raising cash without losing income, which we can reinvest in our core business.”
The reasoning is straightforward.
“We’re not high-rise developers,” Schonfeldt said. “We’re really good at the mall business.”
Rather than pursuing complex development projects directly, Primaris intends to focus on operating malls while allowing specialist developers to undertake residential, hospitality or other projects on lands acquired from the company.
“We’ll let the mall operators operate malls and let the land developers develop land,” he said.
The strategy allows Primaris to unlock value while maintaining a clear focus on its core expertise.
Dufferin Mall Provides a Case Study
One property that illustrates the opportunity is Dufferin Mall in Toronto.
Located adjacent to a subway station and surrounded by ongoing urban intensification, the property sits on land that has become increasingly valuable as the city has grown.
Schonfeldt described Dufferin Mall as one of the company’s strongest excess-land opportunities.
“Dufferin Mall has some great land values,” he said.
The site has already undergone significant planning work.
According to Schonfeldt, Primaris has completed rezoning and severance work supporting more than one million square feet of potential future density on a four-acre parcel.
Yet despite the approvals, Primaris is not rushing to market.
The approach reflects the company’s preference to monetize land when market conditions are strongest rather than pursuing transactions simply because entitlements are already in place.
Toronto’s development sector remains challenged, and management believes patience will ultimately create greater value.
“This one to us is an incredible excess land story,” Schonfeldt said. “We think it will best serve our unitholders by deferring a potential sale for a couple of years.”
That flexibility is one advantage of Primaris’ national portfolio. Rather than forcing development activity in weaker markets, the company can prioritize locations where demand, liquidity and development conditions are strongest.
“We’re really looking to work on sites where we’re near the top of the development cycle and where we can maximize proceeds,” Schonfeldt said.
Dufferin Mall in Toronto. Photo: Primaris REIT
Why Existing Shopping Centres Are Becoming More Valuable
The excess land strategy reflects a broader view of Canadian retail real estate.
Schonfeldt argues that existing regional shopping centres are becoming increasingly difficult to replicate. Land assembly is more challenging, construction costs remain elevated and opportunities to build new enclosed malls are limited.
“You need fifty contiguous acres,” he said.
Acquiring that much land and developing a modern regional shopping centre has become increasingly difficult in many Canadian markets.
As a result, he believes existing centres are benefiting from growing scarcity.
“I would say it’s near impossible, which we think creates a big moat or fortress around the existing supply,” he said. “This space is virtually irreplaceable.”
At the same time, retail space per capita continues to decline as population growth outpaces new shopping centre development.
For Primaris, that reinforces the value of maintaining a strong retail platform while selectively unlocking value from lands surrounding its properties.
As Primaris enters its next phase of growth, management increasingly sees the land surrounding its shopping centres as an opportunity to create additional value without losing focus on the malls themselves.
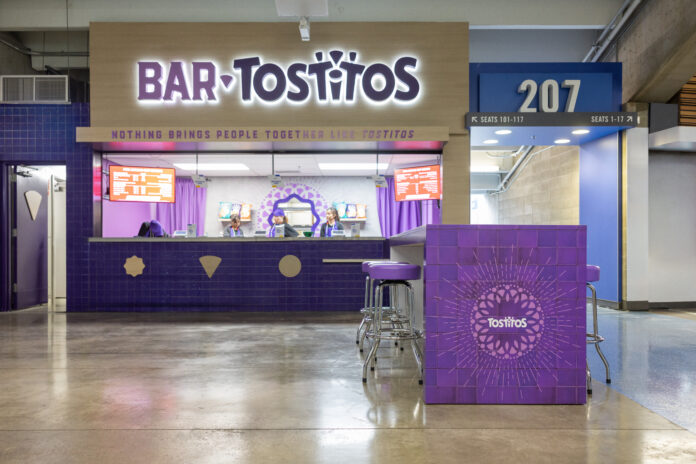
Tostitos has opened its first Bar TOSTITOS food concession at BC Place in Vancouver during the FIFA World Cup 2026, introducing a permanent stadium dining concept that the company says will remain in place after the tournament.
The concession will operate during FIFA World Cup matches at BC Place before continuing as a food outlet for concerts, sporting events and other live entertainment through December 2029.
The launch marks the brand’s first Bar TOSTITOS location and expands its presence beyond packaged snack products into stadium food service. The company said the concept is intended to offer a menu of shareable nacho dishes featuring both Canadian-inspired and internationally influenced flavours for fans attending matches in Vancouver.
“Bar TOSTITOS is more than an in-arena snack, it’s a celebration of togetherness,” said Shirley Mukerjea, Chief Marketing Officer, Tostitos. “We’re proud to create a space where fans can dig in, share great food, and be part of the excitement of the FIFA World Cup right here in Canada.”
Located on Concourse Level 2, Section 207 of BC Place, the concession offers five nacho options served in custom Tostitos x FIFA World Cup 2026 bowls using either Tostitos Restaurant Style tortilla chips or Tostitos Gold tortilla chips.
The menu includes a Canadian Classic Nachos option featuring cheese curds, Canadian back bacon, queso, cheddar, banana peppers, onion and smoky maple aioli. Other offerings include Beef Taco Nachos with seasoned ground beef, cheddar, sour cream, shredded lettuce, diced onion and pico de gallo; Peri Peri Chicken Nachos topped with peri peri chicken, peri mayo, cheese sauce and pico de gallo; Island Jerk Chicken Nachos featuring jerk chicken, mango salsa, lime crema and cilantro; and Classic Nachos served with warm cheese and salsa.
The company said the menu was developed to reflect a range of flavours while providing shareable food options for fans attending matches and other events at the stadium.
Shirley Mukerjea
The concession is designed to combine a traditional stadium concession with a broader food offering as BC Place prepares to host FIFA World Cup matches.
“With Bar TOSTITOS, we’re creating a destination that complements the energy of BC Place Vancouver and the global spirit of the FIFA World Cup,” added Mukerjea. “It’s about making every moment count, because nothing brings people together like Tostitos®.”
Tostitos is one of Frito Lay Canada’s snack brands, alongside Lay’s, Doritos, Ruffles, Smartfood and Cheetos. The company said Bar TOSTITOS will continue operating at BC Place after the FIFA World Cup, serving patrons attending concerts, sports events and other live entertainment through the end of 2029.
New mobility data suggests the opening match of the FIFA World Cup at SoFi Stadium in Inglewood, California attracted a large number of visitors from outside the immediate area while driving higher traffic to nearby retailers, restaurants and hotels, according to Arity.
Arity said its analysis, based on anonymized mobility data from more than 45 million U.S. drivers, found that nearly half of the devices tracked at the event had not been within a 10-mile corridor surrounding SoFi Stadium during the previous week, pointing to a significant non-local presence on match day.
The findings offer an early indication of how the tournament may influence consumer activity in host cities like Toronto and Vancouver as matches continue, based on observed changes in visits to retailers and other businesses surrounding the opening game.
According to the analysis, 48 per cent of devices detected near the stadium on match day had not been in the surrounding 10-mile area during the previous week.
The company also reported a sharp increase in visits to sporting goods stores, with traffic rising 123 per cent compared with the previous Friday. Lunchtime visits to those stores more than doubled over the same period.
Grocery store visits increased 30 per cent overall, while several retailers recorded larger gains.
Arity said visits to Erewhon rose 300 per cent, Costco locations saw a 163 per cent increase, Trader Joe’s recorded a 45 per cent increase and Starbucks visits were up 76 per cent.
The analysis also found higher activity at other nearby businesses as visitors arrived for the match.
Hotel visitations increased 42 per cent, while restaurant visits were up 26 per cent ahead of kickoff.
The company said the patterns observed around the opening match could provide an early indication of how major events influence consumer shopping behaviour and retail traffic as the World Cup continues in other host cities.
Real gross domestic product (GDP) grew 0.5% in April, after contracting 0.1% in March, on strength in both goods-producing and services-producing industries, reported Statistics Canada on Tuesday.
And it said advance information indicates that real GDP by industry increased 0.1% in May.
Goods-producing industries rose 1.2% in April, reflecting growth in most sectors and driven by mining, quarrying, and oil and gas extraction. Services-producing industries grew 0.3%, rising for the third month in a row, driven by growth in the public sector and transportation and warehousing. Overall, 14 of the 20 industrial sectors grew in April, explained the federal agency.
It said the mining, quarrying, and oil and gas extraction sector rose 2.9% in April, the largest monthly growth rate since February 2024 (+3.2%), more than offsetting March’s 1.4% contraction. This third increase in four months was driven by increases in oil and gas extraction, along with support activities for the mining, and oil and gas extraction subsectors.
The public sector aggregate (comprising educational services, health care and social assistance, and public administration) expanded 0.4% in April, on widespread increases across all comprising sectors, added Statistics Canada.
“Public administration (+0.7%) was the largest contributor to the growth for the second consecutive month in April, with higher activity across all levels of government in the month. Federal government public administration (except defence) (+0.6%) posted its first increase in four months while defence services (+0.7%) recorded its seventh consecutive monthly increase. Health care and social assistance (+0.2%) as well as educational services (+0.4%) further added to growth in the public sector,” it said.
“The manufacturing sector rose 0.6% in April, driven by expansions in durable-goods manufacturing industries.
“Durable goods manufacturing industries expanded 1.1% in April, more than offsetting the decline recorded in March. The machinery manufacturing subsector (+3.0%) led the rebound, on strengths in the metalworking machinery manufacturing and industrial machinery manufacturing industry groups, coinciding with higher exports of industrial machinery, equipment and parts. Wood product (+2.6%) and non-metallic mineral product (+5.9%) manufacturing further added to the growth.
Andrew Grantham
“Non-durable goods manufacturing was unchanged in April. Petroleum and coal product manufacturing (+5.8%) expanded for the third consecutive month in April, reflecting ramped-up production in petroleum refineries (+5.6%) and petroleum and coal product manufacturing (except petroleum refineries) (+7.5%). The increase coincided with higher exports of refined petroleum energy products in April. Fully offsetting the growth was a 6.8% contraction in chemical manufacturing.”
“However, this is probably stronger than the underlying pace of growth within the economy, with Q2 flattered somewhat by a rebound in mining, oil & gas, as well as potentially a boost from FIFA World Cup spending and preparations. Because of that we could see growth slow to a slightly more modest pace in Q3, and we continue to see the need for interest rates to remain at current levels to support a sustainable recovery,” he noted.
Marc Ercolao, Economist, TD, said: “April’s stronger-than-expected print points to a better handoff into the second quarter with Q2 growth now tracking above 2.0% annualized. Zooming out, that leaves the first-quarter stumble looking more like a temporary soft patch than the start of a deeper downturn, broadly in line with the Bank of Canada’s view that growth should resume in Q2 even if the economy remains in excess supply.
Marc Ercolao
“The bigger message here is that this reading should take some air out of the recent “technical recession” narrative. The economy is grinding through a soft patch, but household demand is still providing support to activity, while trade exposed industries are pointing to a tentative recovery. For the Bank of Canada, this argues for patience rather than a pivot. Firmer near-term growth lowers the urgency to ease, while inflation pressures that remain contained for now give the Bank cover to stay on the sidelines.”