Welcome to the Daily Synopsis by Retail Insider. We hope you enjoy the 9 articles we published today covering key developments in Canadian retail.
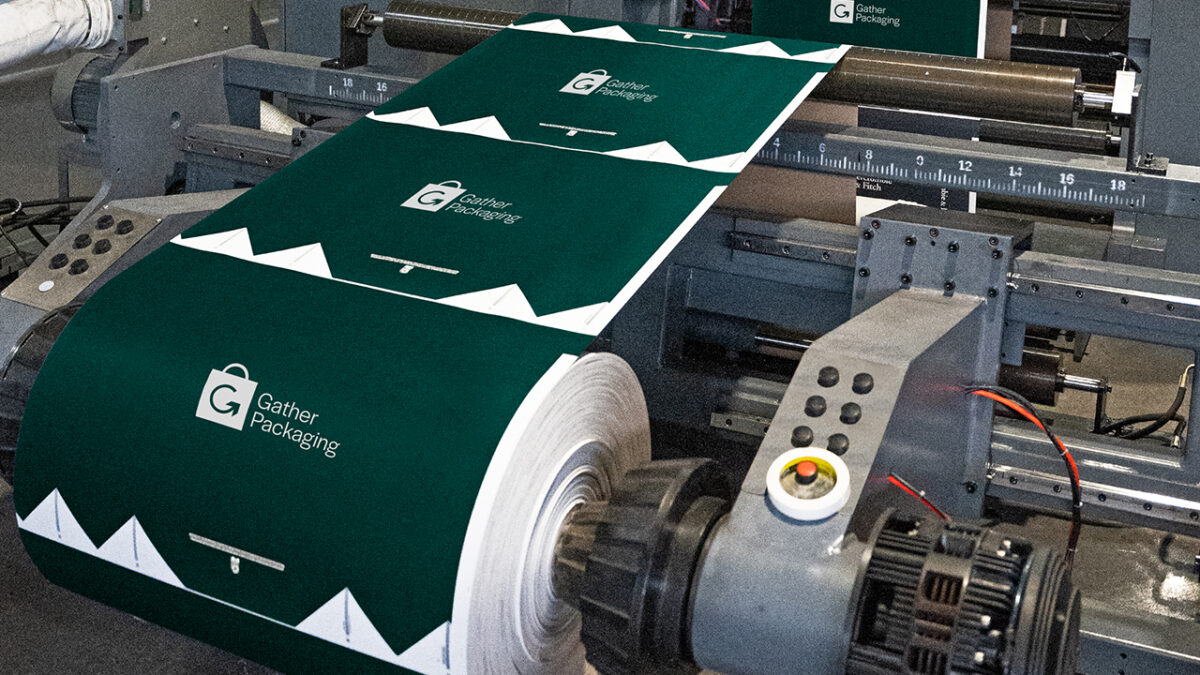
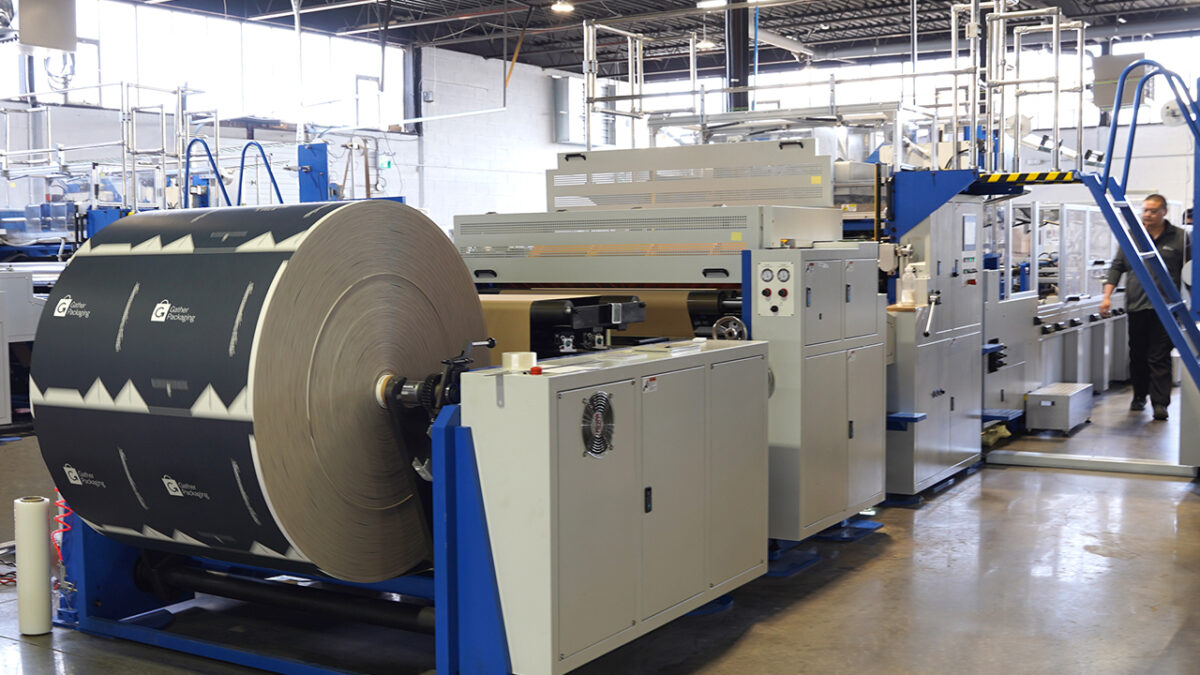
Lululemon’s Canadian sales declined 11% in Q2 amid worsening traffic and product challenges, with an even steeper downturn expected in the near term. Gather Packaging, a Toronto-based manufacturer previously reliant on U.S. markets for over 75% of its volume, accelerated production to export before a new 50% U.S. tariff took effect, severely impacting its American sales. Alimentation Couche-Tard is reshaping its convenience store assortments by emphasizing food, energy drinks, and functional beverages amid declining demand for traditional categories like carbonated soft drinks and snacks.
Retail Insider’s remaining coverage is included in the full article list below.
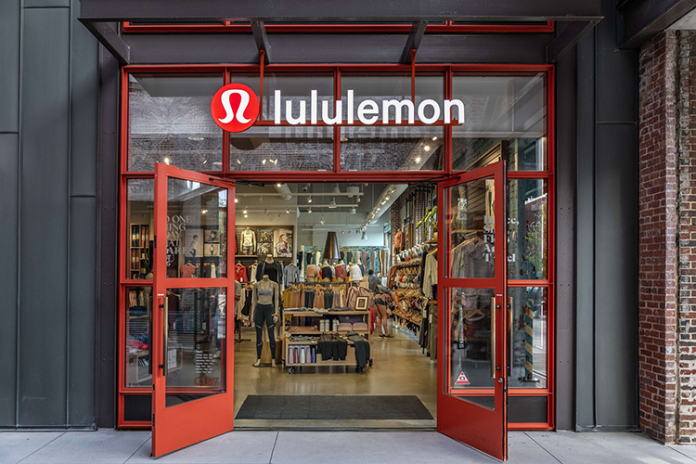
Vancouver-based lululemon athletica is facing a sharp deterioration in its Canadian business, with revenue falling 11% in the second quarter as weaker traffic and inconsistent product performance weighed on sales across North America.
The athletic apparel retailer reported second-quarter net revenue of approximately US$2.4 billion, down 4% from a year earlier, while comparable sales declined 10% on a constant-currency basis. North American revenue fell 8%, with Canada underperforming the region as revenue declined 11% on a reported basis and 9% after adjusting for currency movements. U.S. revenue was down 8%.
The outlook suggests conditions will weaken further. Lululemon expects North American revenue to decline in the mid-teens during the third quarter, with Canada expected to perform below that level, while company-wide revenue is forecast to fall between 10% and 11%.
The results mark a significant reversal for a retailer that was still growing its Canadian business several years ago. Canadian revenue increased by nearly 10% in fiscal 2024 before growth slowed to less than 1% in fiscal 2025. Revenue then declined approximately 3% on a reported basis in the first quarter of fiscal 2026 before the drop accelerated to 11% in the second quarter.
The weakening performance in lululemon’s home market comes as the company confronts broader challenges involving store traffic, product relevance and changing consumer preferences. Management acknowledged during its earnings call that efforts to improve the business have not generated the response it had anticipated heading into the second half of the year.
“We expected a better response than we are seeing as we enter the second half of the year,” interim co-CEO and CFO Meghan Frank told analysts.
Sales Weaken Across North America
Lululemon’s second-quarter performance reflected pressure across several parts of the business. Total net revenue declined 4% to approximately US$2.4 billion, while North American revenue fell 8%.
China Mainland revenue increased 4% on a reported basis but declined 2% in constant currency. Revenue across the company’s remaining international markets increased 5%, or 6% in constant currency.
Store-channel sales declined 6%, while digital revenue was also down 6% and contributed approximately US$900 million, or 39% of total revenue. Performance weakened across major merchandise categories as women’s revenue declined 4%, men’s revenue decreased approximately 1%, and accessories and other revenue fell 13%.
Lululemon ended the quarter with 825 company-operated stores globally, up from 784 a year earlier. The company opened nine net new stores during the quarter.
The company’s reported profitability was helped substantially by refunds of tariffs previously paid under the U.S. International Emergency Economic Powers Act. Lululemon recognized US$134.5 million in tariff refunds during the quarter, along with associated interest.
Net income was approximately US$329 million and diluted earnings were $2.92 per share, compared with $3.10 a year earlier. The tariff refunds and associated interest contributed approximately $0.86 per diluted share, while the refunds added 560 basis points to operating margin.
Operating income was approximately US$454 million, while operating margin declined to 18.8% from 20.7% a year earlier. Gross margin increased 200 basis points to 60.5%, reflecting the substantial benefit from the tariff refunds. Excluding that benefit, product margin faced pressure from higher tariffs and markdowns, partially offset by higher pricing and lower product costs.
Traffic and Product Challenges Weigh on Sales
Management identified weakening traffic as the biggest contributor to current sales pressure, with conversion rates also running below year-ago levels. The weakness has affected both physical stores and digital channels.
Frank told analysts that lululemon has experienced pressure on brand sentiment and is increasing marketing investment as it works to drive customer acquisition and traffic. The company is also contending with an inconsistent response to new merchandise.
Lululemon entered the year with an action plan focused on product creation, product activation and enterprise improvements. Management saw some encouraging signs during the first quarter, but the response to product launches became less consistent as the company moved through Q2.
Consumer research conducted by lululemon has found that shoppers are looking for new and differentiated products and greater innovation from the brand. The company has been shortening parts of its product-development process while increasing its ability to respond quickly when new merchandise performs well.
Lululemon is chasing approximately 20% more product volume than last year, allowing it to reorder stronger-performing merchandise more aggressively while managing future inventory commitments. The strategy is intended to help the retailer react faster to changing demand and reduce exposure to products that are not resonating with customers.
Women’s Legging Sales Fall Approximately 20%
One of the clearest examples of the changing product environment is occurring in the category most closely associated with lululemon. Women’s legging sales declined approximately 20% during the second quarter, a larger drop than management had anticipated.
The company said shoppers have been shifting toward looser, “away-from-body” silhouettes, while demand for leggings has softened. Several newer styles are performing well, including the Groove Wide-Leg, Align Foldover Jogger, Breezily and an updated Dance Studio Pant, but those gains have not yet been enough to offset the decline in leggings.
Overall bottoms sales declined in the mid-single digits during the quarter, indicating that stronger demand for newer silhouettes is offsetting some of the weakness in traditional leggings. Lululemon said leggings remain an important part of its business, particularly for activities including yoga and Pilates, and maintains that it remains a market leader in the category.
Elsewhere in the assortment, management pointed to strength in the Define and Scuba franchises. Men’s Metal Vent Tech shirts and golf tops also performed well, with the golf assortment supporting demand for ABC bottoms.
Accessories remain under pressure, with revenue in the category declining 13%. Stronger backpack sales were not enough to offset weakness in bags.
Lululemon Increases Marketing as Brand Engagement Remains Strong
Lululemon plans to increase marketing investment during the second half of the year, with spending directed toward social and creator content, community events and other brand-building initiatives. The strategy comes as management works to turn consumer engagement with lululemon into stronger traffic and sales.
That was particularly evident this summer in Vancouver, where lululemon revived its SeaWheeze Half Marathon and Festival for the first time since 2019. Nearly 10,000 runners from 24 countries participated in the half marathon, while approximately 14,000 people attended the accompanying festival. A virtual SeaWheeze challenge on Strava attracted more than 85,000 participants from 120 countries.
Lululemon has already decided to bring SeaWheeze back next summer. Management said community events and recent campaigns have generated encouraging engagement but have not yet produced an improvement in the company’s top-line trajectory.
The company is planning additional activations during the fall marathon season, including in Toronto, New York and Chicago, as it looks to rebuild traffic and strengthen product consideration.
Canadian Sales Expected to Weaken Further
The company’s third-quarter forecast indicates that the slowdown is expected to become more pronounced. Lululemon expects revenue of between US$2.29 billion and US$2.32 billion for the quarter, representing a decline of approximately 10% to 11%.
North American revenue is expected to decline in the mid-teens, with Canada performing below the regional rate. China Mainland and the company’s other international markets are each expected to generate reported revenue growth of between 3% and 5%.
Profitability is also expected to fall considerably. Lululemon forecasts a third-quarter operating margin of approximately 6.5%, compared with 17% during the same period last year, while diluted earnings are expected to range from $0.93 to $0.98 per share, down from $2.59.
Slower sales will require additional seasonal clearance, according to the company, with markdowns expected to increase by approximately 60 basis points during the quarter.
For fiscal 2026, lululemon now expects revenue of between US$10.35 billion and US$10.5 billion, representing a decline of approximately 5% to 7% from fiscal 2025. North American revenue is forecast to decline in the low double digits, with Canada expected to perform slightly below the regional rate.
China Mainland revenue is expected to increase in the high single digits, while the rest of the international business is expected to grow in the mid-single digits. Full-year diluted earnings are forecast at between $9.48 and $9.73 per share, compared with $13.26 in fiscal 2025.
The forecast includes the $0.86-per-share benefit from tariff refunds and associated interest recognized during the second quarter and assumes no additional tariff recoveries. Operating margin is expected to decline approximately 530 basis points for the year, including the benefit from the tariff refunds.
Store Expansion Slows as Costs Come Under Review
Lululemon is becoming more selective about physical expansion as sales weaken. The retailer now expects to open approximately 35 net new company-operated stores globally during fiscal 2026, down from its previous guidance of approximately 40, while its number of pop-up stores is expected to fall from 65 at the end of last year to approximately 40 by the end of 2026.
Management said it is scrutinizing every new-store opening and optimization project. Approximately 10 of this year’s net new stores will be in North America, including seven in Mexico.
Management said roughly half of the North American openings involve converting pop-ups that have already demonstrated strong productivity. The remainder involve strategic locations or additional stores in existing markets where the company sees an opportunity for further penetration.
Lululemon’s Canadian store base has remained relatively stable in recent years. The company had 71 company-operated stores in Canada at the end of fiscal 2024 and fiscal 2025, with the count increasing to 72 as of May 3, 2026.
The company is also examining expenses across the organization, including supply chain operations, procurement, travel, professional fees, store labour hours and the pace of headcount growth. Frank told analysts that lululemon is taking a deeper look at its cost structure given current sales trends, while protecting investment in product and marketing.
New CEO Heidi O’Neill Arrives at a Critical Point
The weaker outlook comes days before Heidi O’Neill takes over as lululemon’s new Chief Executive Officer. O’Neill is scheduled to begin September 8 following a 27-year career at Nike, where she held senior roles spanning consumer strategy, product, brand, apparel and marketplace development.
Her arrival comes as lululemon deals with declining North American sales, a rapidly weakening Canadian business and changing preferences within women’s apparel. Management said O’Neill will conduct a deep review of the business, its strategy and the action plan currently underway.
In the meantime, lululemon is increasing investment in product and marketing while reducing expenses elsewhere and becoming more selective about store expansion. The company’s experience in Canada illustrates the challenge ahead: lululemon continues to draw substantial participation around community initiatives such as SeaWheeze in Vancouver, but that engagement has yet to translate into stronger sales.
With management forecasting an even steeper Canadian decline in the third quarter, reversing the deterioration in traffic and improving the response to its product assortment will be among the immediate challenges facing the company’s new leadership.
The beauty industry continues to be one of the most competitive and fast-moving categories on Amazon. In 2026, shoppers are not only searching for affordable cosmetics. They are looking for products that feel trustworthy, useful, visually attractive, easy to understand, and worth buying again.
For beauty sellers, this means success now depends on much more than uploading a product, adding a few keywords, and waiting for sales. Customer expectations are higher, competition is stronger, and buyers are becoming more careful about ingredients, product quality, reviews, sustainability, packaging, and brand credibility.
Amazon beauty accessories market trends in 2026 show a clear shift toward practical products, personalised beauty routines, social-media-inspired purchases, convenient formats, and stronger product presentation. Sellers who understand these changes can improve visibility and create a stronger position in an increasingly crowded marketplace.
What Is Driving the Amazon Beauty Market in 2026?
Beauty shopping habits have changed significantly. Customers often discover a product on TikTok, Instagram, YouTube, or through an influencer before searching for it on Amazon.
This means Amazon frequently becomes the final buying destination rather than the first discovery platform.
Consumers want quick access to products they have already seen demonstrated online. They also expect detailed listings, clear photos, strong ratings, fast delivery, and enough information to compare similar items confidently.
Several factors are influencing beauty sales in 2026:
Growth of at-home beauty routines
Demand for multifunctional products
Increased interest in affordable premium beauty
Social media-driven product discovery
Greater attention to skin-friendly formulations
Rising interest in sustainable packaging
Strong demand for travel-friendly products
Increased popularity of beauty tools and accessories
Preference for visually appealing product presentation
These behaviours create opportunities for established brands as well as smaller Amazon sellers.
Best Selling Cosmetic Products in 2026
Understanding the best selling cosmetic products is important because high demand often reveals what customers currently value.
Skincare remains one of the strongest segments. Consumers are spending more time researching products designed for hydration, skin barriers, ageing concerns, uneven texture, and everyday protection.
Popular categories include facial serums, moisturisers, cleansing balms, lip treatments, eye products, sunscreen, and targeted skincare solutions.
Makeup products also continue to perform well, although purchasing behaviour is changing. Buyers increasingly favour products that are quick to apply and suitable for everyday routines.
Examples include:
Lip oils and tinted lip products
Lightweight foundations
Cream blushes
Brow gels
Concealers
Setting sprays
Mascara
Multi-use makeup sticks
Beauty accessories also play a major role. Makeup brushes, cosmetic organisers, facial tools, reusable applicators, travel bottles, cosmetic bags, and skincare accessories are attractive categories because they can appeal to a broad customer base.
The strongest products normally solve a clear problem. A beauty product that looks fashionable but provides little practical value may struggle to generate repeat purchases.
Best New Beauty Products Shaping Consumer Demand
The best new beauty products in 2026 are often products that combine convenience, innovation, and strong visual appeal.
Consumers are increasingly interested in hybrid beauty products. These are products designed to deliver more than one benefit.
For example, customers may prefer a tinted moisturiser with skincare properties instead of purchasing separate products. Similar interest exists around lip products that provide colour and hydration, primers containing skincare ingredients, and multipurpose beauty sticks.
Another major trend is simplified beauty.
Complicated routines are not disappearing, but many shoppers are searching for products that reduce the number of steps required in their daily routines.
Beauty brands are therefore developing:
Two-in-one cosmetic products
Compact travel products
Refillable beauty items
Reusable accessories
Easy-to-clean beauty tools
Portable skincare devices
Consumers also want products that look attractive enough to share on social media. Visual design, colour selection, container shape, and overall presentation can influence how premium a product feels.
Packaging becomes especially important in this environment. A well-designed product placed inside professional lingerie gift boxes can create a stronger impression before the customer even uses the product.
Beauty Accessories Are Becoming More Important
Amazon’s beauty category is not limited to cosmetics and skincare formulas.
Beauty accessories have become a major part of the market because consumers increasingly perform treatments and beauty routines at home.
Popular accessory categories include facial rollers, makeup applicators, cosmetic storage, manicure tools, hair accessories, travel organisers, beauty mirrors, reusable cleansing pads, brush cleaning tools, and skincare applicators.
One advantage of beauty accessories is that customers often understand their purpose immediately.
For example, a brush organiser solves a storage problem. A makeup sponge helps with product application. A travel cosmetic case helps users carry beauty products safely.
Products with an obvious benefit are easier to demonstrate through Amazon images and video content.
This is important because customers usually scroll quickly. Sellers have only a short period of time to communicate why a product deserves attention.
How to Sell Beauty Products on Amazon
Learning how to sell beauty products on amazon requires more than basic marketplace knowledge.
The first step is choosing products with real customer demand. Sellers should study existing listings, customer reviews, pricing ranges, product complaints, keyword trends, and competitor positioning.
Instead of simply copying a successful product, look for weaknesses in existing offers.
For example, customers may repeatedly complain that a beauty organiser is too small, a brush set feels cheap, a cosmetic container leaks, or instructions are unclear.
These complaints are useful market research.
A seller can use that information to improve the product or listing.
The next step is creating a detailed Amazon product page. A strong listing should clearly explain:
What the product is
Who it is designed for
How it should be used
What problem it solves
Important dimensions or quantities
Key materials or ingredients
Safety or care information
What is included in the package
High-quality images are equally important.
Customers cannot physically inspect an Amazon product before purchasing it, so photography must reduce uncertainty.
Show the product from several angles, include close-up details, demonstrate scale, and add lifestyle images when appropriate.
Product Presentation Can Influence Buying Decisions
Beauty is a highly visual category.
A customer may compare several similar products before choosing one. If the formulas, prices, or functions appear similar, visual presentation can become an important deciding factor.
Professional packaging helps communicate organisation and brand consistency.
For products displayed in physical retail environments as well as sold online, Cosmetic Display Boxes can also support clearer product presentation and make products easier to showcase.
Amazon sellers should think about the complete customer journey.
The customer sees the product image first, reads the listing, places an order, receives the parcel, opens the packaging, and finally uses the product.
Every stage affects their perception of the brand.
A poor unboxing experience may not immediately cause a negative review, but it can reduce the perceived value of the purchase.
Reviews Are Becoming More Important Than Marketing Claims
Modern beauty shoppers are sceptical.
They know that product descriptions are written to promote products, so many buyers move quickly to the review section before making a decision.
They search for comments about:
Quality
Durability
Texture
Size
Smell
Ease of use
Packaging condition
Product accuracy
Value for money
Sellers should study reviews continuously.
Reviews are not only a reputation tool. They are a valuable source of product development information.
If customers repeatedly ask the same question, update the listing.
If customers misunderstand the size, improve the images.
If buyers report damaged packaging, strengthen the fulfilment or packaging process.
Brands that respond to customer behaviour are more likely to remain competitive over time.
Social Media Will Continue Influencing Amazon Searches
Beauty trends can move extremely quickly.
A product may receive little attention for months and suddenly experience major demand after appearing in a viral video.
Amazon sellers should therefore monitor social platforms alongside marketplace keyword data.
However, chasing every viral product can be risky.
Trends may disappear quickly, leaving sellers with excess inventory.
A stronger strategy is combining trend-based opportunities with products that have steady long-term demand.
For example, makeup organisers, cosmetic bags, brushes, skincare accessories, and everyday beauty tools may benefit from social media exposure while still maintaining practical long-term value.
Sustainable Packaging Is Becoming a Competitive Factor
Environmental concerns continue to influence purchasing decisions.
Customers are increasingly aware of excessive packaging, unnecessary plastic, and difficult-to-recycle materials.
Beauty companies can respond by reducing unnecessary packaging while still protecting products during delivery.
Sellers purchasing packaging in larger quantities may also look at cosmetic boxes wholesale solutions to maintain consistent presentation while managing per-unit packaging costs.
However, sustainability claims should remain accurate.
Brands should avoid vague environmental statements unless they can explain what makes the material, production process, or packaging design more sustainable.
Trust is especially important in beauty because customers are placing products directly on their skin, hair, or body.
Pricing Must Match Perceived Value
Amazon customers compare prices instantly.
That does not mean the cheapest product always wins.
Buyers often pay more when the product appears safer, better designed, more durable, easier to use, or better reviewed.
Successful pricing therefore depends on perceived value.
A higher-priced product should give customers a clear reason for the difference.
That value may come from:
Better ingredients
Higher material quality
Larger quantities
Improved design
Useful accessories
Better packaging
Stronger guarantees
More detailed instructions
Competing entirely on low prices can create a difficult business model because another seller can always reduce prices further.
Mobile Shopping Should Influence Listing Design
A large proportion of customers browse online marketplaces using mobile devices.
Long paragraphs and complicated product images can therefore reduce engagement.
Amazon listings should be easy to scan.
Use simple image layouts, readable labels, short benefit-focused bullet points, and clear product comparisons.
The most important information should appear early because many customers may not read every section of the listing.
Product titles should also remain descriptive without becoming difficult to understand.
Keyword optimisation is important, but readability should never be sacrificed simply to include more search terms.
Building Trust Will Matter More in 2026
The beauty market is crowded with products making similar promises.
This makes trust one of the strongest competitive advantages.
Brands can improve credibility by providing accurate product information, realistic photography, transparent ingredient details, proper instructions, clear customer support, and consistent product quality.
Sellers should avoid exaggerated claims.
For example, promising unrealistic skin transformations may attract attention initially, but disappointed customers can quickly damage a listing through negative reviews.
Long-term sellers usually perform better when customer expectations match the actual product experience.
Final Thoughts
Amazon beauty accessories market trends in 2026 show that the category is becoming more sophisticated rather than simply larger.
For sellers, the opportunity is significant, but success requires proper research.
Study customer problems rather than simply following competitors. Improve weak points in existing products. Use professional product presentation, clear Amazon listings, useful images, responsible marketing, and consistent quality.
Beauty trends will continue changing quickly, especially as social media introduces customers to new products and routines. However, the strongest brands will not rely only on temporary trends.
They will combine current demand with practical value, customer trust, distinctive presentation, and products people genuinely want to purchase again.
Canadian appliance shoppers have never had more technology to choose from.
Floor-care products that once competed largely on suction, battery life and price are now being differentiated through dirt sensors, heated cleaning, lay-flat designs, anti-tangle systems, self-cleaning cycles and increasingly elaborate docking stations.
That innovation creates opportunity for retailers.
It also creates a problem.
As product ranges become more sophisticated, the consumer has to work harder to understand why one appliance costs several hundred dollars more than another — and whether the additional technology will materially improve the way the household cleans.
That question is particularly relevant as Canadian retail becomes more polarized between consumers prioritizing value and those who remain willing to spend on differentiated premium products. Retail Insider’s Q2 2026 consumer report describes a market shaped by affordability pressure, selective spending and increasingly divergent consumer behaviour.
Smart floor care provides a useful case study of that wider retail challenge.
Tineco’s expanding Canadian lineup illustrates both sides of the equation: consumers can now choose highly automated premium systems, more accessible everyday floor washers and dedicated dry-vacuum products — but the growing number of features also makes the path to purchase less straightforward.
Appliance innovation is running into a value test
The wider appliance industry has already been warned about the gap between product innovation and what consumers actually say they value.
Research covered by Retail Insider in July found that, among 5,610 U.S. consumers surveyed by Curion, 45% identified long-term reliability as the most important appliance-purchase factor and 27% prioritized price/value.
Smart features ranked as the primary driver for just 2.7%.
The research is U.S.-based rather than Canadian, so it should not be treated as a direct measurement of Canadian appliance shoppers.
But the underlying tension is relevant north of the border.
Manufacturers continue to add technology.
Consumers continue to ask:
Will this make my life meaningfully easier — and is it worth paying for?
That is where the current generation of smart floor-care products becomes interesting from a retail perspective.
The technology itself may attract attention.
The sale depends on translating that technology into an outcome.
Tineco’s lineup shows how quickly the category is segmenting
A few years ago, the distinction was relatively simple:
vacuum cleaner or mop.
Now, a shopper researching Tineco in Canada can encounter products designed around very different priorities.
The company currently lists 16 wet-dry vacuum cleaners and seven smart vacuum cleaners in its Canadian product catalogue, giving consumers a relatively broad range of configurations before competitors are even added to the comparison.
That makes product-family education increasingly important.
FLOOR ONE
This is primarily Tineco’s wet-dry category.
The machines are designed to wash suitable hard flooring while collecting compatible wet and dry debris.
PURE ONE
These are conventional cordless dry vacuums aimed more at:
carpet;
rugs;
upholstery;
stairs;
dry pet hair;
whole-home vacuuming.
That distinction is simple once explained.
But it is easy for a consumer scanning product names, suction figures and “Station” branding to miss.
The original buying-guide version of this article correctly identified that a powerful PURE ONE does not automatically replace a FLOOR ONE wet-dry cleaner.
For retailers, that is a merchandising issue as much as a product issue.
The category now contains multiple versions of “premium”
Premiumization does not mean every high-end shopper wants the same thing.
Tineco’s current assortment demonstrates at least four different premium propositions.
Consumer priority
Representative Tineco product
What is actually being sold
Stubborn hard-floor mess
FLOOR ONE S9 Artist Steam
Steam-assisted premium cleaning
Everyday wet-dry versatility
FLOOR ONE S7 Stretch Ultra
Lay-flat access and anti-tangle convenience
Maximum floor-washer automation
STATION S9 Scientist Pro
Reduced tank interaction and automated maintenance
Premium dry vacuum convenience
PURE ONE Station 5 Pro
Strong cordless suction plus station-based maintenance
That distinction matters because each product justifies its price differently.
A consumer may be willing to pay more.
But only if the premium is attached to a problem they actually have.
Its Canadian product information highlights 21kPa suction, up to 50 minutes of runtime, FlashDry and a 180° lay-flat design.
The lay-flat capability does not sound as technologically dramatic as steam.
But it may be easier for many consumers to understand.
If debris and pet hair collect underneath:
sofas;
beds;
cabinets;
low furniture,
the benefit is immediately visible.
The same is true of anti-tangle technology.
Consumers do not necessarily need to understand the engineering behind it.
They understand:
“I spend less time cutting hair from the roller.”
That is the difference between a feature and a retail proposition.
The Station S9 Scientist Pro sells reduced interaction
The FLOOR ONE STATION S9 Scientist Procordless wet dry vacuum mop takes the category further into automation.
Its current Canadian listing includes:
automatic water refill;
5L water storage;
HydroBurst cleaning;
180° lay-flat operation;
iLoop sensing;
FlashDry;
up to 110 minutes of runtime.
The most important feature is arguably not the 110-minute figure.
It is the station.
A conventional floor washer requires repeated interaction with relatively small clean- and dirty-water tanks.
A larger station can reduce some of that manual involvement.
That gives retailers a different premium story:
not better cleaning alone, but less cleaning-related administration.
This proposition is likely to make more sense to:
larger households;
frequent cleaners;
pet owners;
consumers with extensive hard flooring.
For a smaller condo where only one or two rooms are cleaned at a time, the station may be unnecessary infrastructure.
The premium only works when the lifestyle supports it.
Station 5 Pro demonstrates why category clarity matters
The PURE ONE Station 5 Pro illustrates another retail challenge.
It is a station-based Tineco product.
But it is not a wet-dry floor washer.
Tineco Canada currently lists the Station 5 Pro with 200AW suction, up to 100 minutes of runtime, 12-stage filtration and full-path self-cleaning.
It is aimed more naturally at:
carpet;
rugs;
stairs;
dry pet hair;
conventional whole-home vacuuming.
A shopper could reasonably want both categories.
But that means the retailer has to explain the distinction clearly.
Otherwise a broad assortment can become a source of confusion rather than choice.
More choice is not always easier shopping
This is one of the wider retail lessons emerging from the category.
Smart floor-care shoppers may now encounter:
Tineco
Dreame
Roborock
Dyson
Bissell
and other established cleaning brands before they even begin comparing individual models.
Within each brand, the consumer then encounters:
steam vs non-steam;
hot water vs conventional washing;
station vs standard dock;
wet-dry vs dry vacuum;
lay-flat vs upright;
self-cleaning vs self-drying;
anti-tangle technologies;
different suction measurements;
different runtime claims.
From an engineering perspective, that reflects genuine innovation.
From a consumer perspective, it can create friction.
The solution is not necessarily fewer products.
It is better decision architecture.
Retailers should merchandise around problems, not specifications
Instead of presenting twenty cleaners mainly by price and feature count, the category can be made easier to navigate through use cases.
“I have pets and hard flooring”
Lead with:
anti-tangle;
wet-and-dry pickup;
easy roller maintenance.
“I have a small condo”
Lead with:
storage footprint;
lay-flat design;
practical runtime;
whether a large station is really necessary.
“I have a large hard-floor home”
Lead with:
runtime;
tank capacity;
station automation;
refill frequency.
“I have mostly carpet”
Move the shopper away from FLOOR ONE entirely.
A PURE ONE or another conventional dry-vacuum platform may be the better purchase.
“I regularly deal with dried kitchen mess”
This is where heated or steam-assisted cleaning becomes easier to justify.
The result is a more useful retail experience:
problem → relevant technology → suitable tier
rather than:
technology → more technology → premium price.
Retailers also need to separate “smart” from “useful”
Not every automation feature carries the same value.
For consumers, some technologies are easier to translate into practical outcomes.
Dirt sensing
Potential consumer outcome:
less manual mode switching
Lay-flat design
Potential outcome:
less furniture movement
Anti-tangle technology
Potential outcome:
less brush maintenance
Heated self-cleaning and drying
Potential outcome:
less hands-on roller care
Large automated station
Potential outcome:
fewer refills and less direct contact with dirty water
Steam
Potential outcome:
more targeted help on stubborn dried residue
This is the language that makes increasingly complicated appliance technology easier to sell.
It also makes premiumization more defensible.
Value pressure does not mean premium is disappearing
Retail Insider’s recent Canadian retail reporting repeatedly points toward a polarized market.
Value retail has become increasingly central to Canadian retail strategy, while premium and differentiated propositions can still perform when consumers understand what they are paying for.
That distinction is important for smart appliances.
The winning strategy is unlikely to be simply:
“make everything cheaper.”
Nor is it:
“add another feature.”
The stronger proposition is:
make the price difference easier to understand.
The S7 Stretch Ultra may therefore be the better value proposition for one household even when the S9 Artist Steam is technically more advanced.
The original consumer guide made this point well:
for many homes, the S7 may already be enough, and spending more does not automatically make sense when the main mess is crumbs, spills, footprints and ordinary pet debris.
That is more than buying advice.
It is a lesson in assortment architecture.
A premium range works better when each step upward has a clear reason to exist.
The competitive story is no longer simply Tineco versus Bissell
Competition has become more technically diverse.
Dreame has expanded aggressively in heated wet-dry cleaning and automated maintenance.
Roborock has extended beyond robotic cleaning into manual floor washers.
Dyson now competes in wet hard-floor care through WashG1 while maintaining a strong position in premium dry cordless vacuuming.
Bissell CrossWave remains one of the category’s established reference points.
This means Tineco is no longer selling the idea of wet-dry cleaning into an immature market.
It is competing inside an increasingly sophisticated category.
For retailers, that changes the conversation.
The key question becomes less:
“Why buy a wet-dry vacuum?”
and increasingly:
“Which type of wet-dry technology is worth paying for?”
Canadian conditions make use-case merchandising particularly relevant
Canada adds some obvious household scenarios that make this category easier to explain.
Winter creates:
slush;
road salt;
wet entrance areas;
grit.
Spring brings:
mud;
pet footprints;
melting-snow residue.
Pet-owning households add:
fur;
food around bowls;
wet paw marks.
At the same time, Canadian housing spans everything from urban condos to large detached homes.
Those differences naturally create different product requirements.
A Toronto condo does not need to be merchandised the same way as a large suburban home in Calgary.
The cleaner does not change.
The purchase logic does.
This is where stores still have an advantage
A complex appliance category gives physical and assisted retail an opportunity.
Some benefits are much easier to demonstrate than describe.
A consumer can immediately understand:
how far a machine reclines;
how large the station is;
how easy a dirty-water tank is to remove;
how manoeuvrable the body feels;
how much storage space the system requires.
A specification table struggles to communicate those details.
As premium appliances become more sophisticated, in-store demonstrations and knowledgeable staff can therefore become more—not less—important.
Reviews should be used to diagnose fit, not declare a winner
Customer ratings matter.
But raw star averages are often less useful than repeated themes inside reviews.
The original version of this article noted that Canadian Tineco reviews commonly surface issues such as:
pet hair;
battery performance;
water pickup;
streaking;
odour;
under-furniture manoeuvrability;
replacement parts;
ease of cleaning.
Those themes are valuable because they tell retailers how consumers actually evaluate the product after purchase.
They can also improve merchandising.
If buyers repeatedly praise lay-flat access, retailers should demonstrate it.
If maintenance questions recur, explain the self-cleaning process before purchase.
If consumers misunderstand wet-dry versus dry vacuuming, fix the category signage.
Reviews become more useful when treated as merchandising intelligence rather than just social proof.
What retailers can take from the floor-care category
The smart floor-care market provides several wider lessons for appliance retail.
1. Premium features need a visible job
Consumers should understand what problem each technology solves.
2. Wider ranges create a guidance obligation
More SKUs without clearer navigation can increase decision friction.
3. Product-family distinction matters
Wet-dry floor washers and conventional cordless vacuums should not be merchandised as though they solve identical problems.
4. Value does not always mean entry-level
A mid-premium model that solves the customer’s real problem can offer better perceived value than either the cheapest or most expensive product.
5. Automation is easier to sell as reduced effort
“Self-cleaning” is more meaningful when translated into fewer maintenance steps.
6. Retail experience still matters
Some premium appliance benefits are physical and easier to understand through demonstration than e-commerce specifications.
Frequently Asked Questions
Is a Tineco wet and dry vacuum worth it in Canada?
It can be, particularly for households with substantial sealed hard flooring that clean frequently and value reduced maintenance. The stronger buying case comes from matching features such as lay-flat access, anti-tangle technology, self-cleaning or steam to a real household problem rather than simply choosing the most advanced model.
Which Tineco FLOOR ONE model offers the best value?
For many households, the FLOOR ONE S7 Stretch Ultra may represent the more balanced option because it combines everyday wet-dry cleaning, 180° lay-flat access, anti-tangle technology and FlashDry without requiring consumers to pay for every premium feature. The S9 Artist Steam makes more sense where steam-assisted cleaning is genuinely useful.
What is the difference between Tineco FLOOR ONE and PURE ONE?
FLOOR ONE products are primarily designed to wash compatible hard floors while collecting suitable wet and dry debris. PURE ONE products are conventional cordless dry vacuums intended more for carpet, rugs, upholstery, stairs and dry pet hair.
For retailers, making this distinction clear is important because the two product families solve different cleaning problems.
Is the Tineco S9 Artist Steam better than the S7 Stretch Ultra?
Not automatically.
The S9 Artist Steam adds premium steam-assisted cleaning and is aimed more at households dealing with stubborn dried residue. The S7 Stretch Ultra may offer better value where the priorities are routine wet-dry cleaning, pet hair and access beneath low furniture.
The better purchase depends on which feature the household will actually use.
Is Tineco good for pet hair?
For pet hair on compatible hard floors, models with anti-tangle technology such as the S7 Stretch Ultra can be relevant. For carpet, sofas, stairs and upholstery, a PURE ONE dry cordless vacuum is usually the more appropriate category.
Can a Tineco replace both a vacuum and a mop?
A FLOOR ONE can replace much of the routine vacuum-and-mop process in homes dominated by compatible sealed hard flooring.
It will not normally eliminate the need for a dry vacuum in homes with carpet, rugs, stairs or significant upholstery.
Tineco vs Dreame or Roborock: which is better?
There is no universal winner.
Tineco has a broad FLOOR ONE platform with smart sensing, lay-flat designs, anti-tangle systems and station-based automation. Dreame has become a strong competitor in heated cleaning and automated maintenance, while Roborock has expanded aggressively into smart wet-dry floor care.
Consumers should compare exact models by cleaning method, maintenance requirements, floor compatibility and price rather than relying on brand reputation alone.
What should Canadian retailers emphasize when selling smart floor-care products?
Retailers may get better results by merchandising around use cases rather than specifications.
For example:
pet households → anti-tangle and wet-dry cleaning;
condos → storage footprint and lay-flat design;
large homes → runtime, tank capacity and station automation;
carpet-heavy homes → dry cordless vacuum;
stubborn kitchen mess → steam or heated cleaning.
This can reduce decision friction and make the reason for different price tiers easier to understand.
What should shoppers actually ask?
For all the technology in the category, the consumer decision can still be simplified.
Before comparing brands, ask:
What percentage of the home is hard flooring?
Is the most common mess dry, wet or mixed?
Are pets part of the equation?
Does debris collect under low furniture?
How often is the floor cleaned?
Is steam genuinely necessary?
Would a large station be useful or simply take up space?
Will a separate dry vacuum still be required?
Those questions narrow the market more effectively than comparing dozens of specifications.
The bigger retail opportunity is clarity
Smart floor care is becoming more sophisticated.
Tineco’s Canadian range alone now spans multiple levels of wet-dry cleaning, station-based automation and conventional dry vacuuming.
Competitors are adding their own variations.
That gives Canadian retailers more premium products to sell.
But it also raises the bar for how those products need to be presented.
Retail Insider has already highlighted the tension between appliance-industry innovation and consumers’ continued focus on reliability and value.
Smart floor care demonstrates exactly what that tension looks like on the shelf.
The winner may not ultimately be the brand with the longest specification list.
It may be the brand — and retailer — that makes an increasingly complicated category easiest to understand.
Because in a market where consumers are becoming more selective, clarity itself has become part of the value proposition.
References
Retail Insider — Q2 2026 Consumer Behavior and Retail Economy: A Market Increasingly Divided. Canadian consumer caution, affordability pressure and spending polarization.
Retail Insider — Appliance industry innovating against its own customer. Curion research on reliability, value and smart-feature priorities in appliance purchasing.
Retail Insider — Q2 2026 Canadian Discount, Value and Off-Price Retail. Value-driven consumer behaviour and the growing strategic importance of value retail.
Retail Insider — Smart Home Appliance Trends in Canada. Existing coverage of premium smart floor care in the Canadian market; this article intentionally approaches the category from consumer decision-making and retail assortment rather than repeating the technology-trend angle.
Tineco Canada — FLOOR ONE S9 Artist Steam. Current Canadian specifications including 22kPa suction, up to 75 minutes runtime, iLoop sensing and 180° lay-flat design.
Tineco Canada — FLOOR ONE STATION S9 Scientist Pro. Auto water refill, 5L water storage, HydroBurst and up to 110 minutes runtime.
Tineco Canada — PURE ONE Station 5 Pro. 200AW suction, up to 100 minutes runtime and full-path self-cleaning.
A restaurant tenant can hold a signed lease and a fully specified kitchen package and still miss its opening date. The cause is often labour, not capital: too few qualified tradespeople available on site.
Training providers such as the Skilled Trades College of Canada Vaughan Campus sit at one end of that supply chain; a half-finished electrical rough-in inside a Vaughan retail unit sits at the other. The distance between the two carries a price. The Conference Board of Canada estimates that skilled-labour shortages cost the Canadian economy $2.6 billion in lost GDP in 2024.
Housing has dominated the public conversation about that shortage. Yet retailers and restaurant operators compete for the same electricians and HVAC technicians who staff residential and institutional projects. They feel the squeeze somewhere specific: an electrical panel still awaiting energization behind a half-built service counter.
Why the Skilled Trades Shortage Is Reaching GTA Retail Construction
Retail Fit-Outs Depend on a Sequenced Chain of Trades
A commercial fit-out is not a single build. It is a sequence. Contractors must establish electrical capacity before installing lighting and equipment circuits; they must size and install ventilation before commissioning a cooking line, and they typically rough in drainage earlier still.
Miss one trade, and the schedule does not simply pause where it stopped. Kitchen equipment cannot be commissioned until its electrical and ventilation connections are finished. One missing technician can hold up inspections and handover. The contractor then has to reshuffle other crews to cover the gap, and that rarely comes free.
An Aging Workforce Is Tightening the Labour Pool
The arithmetic behind the shortage is straightforward. The Government of Canada reported that roughly 700,000 skilled trades workers are expected to retire by 2028 across Canada. Their departure will drain experienced, qualified workers from the labour market.
The replacement side is thinner than it used to be. Census data shows that between 2016 and 2021, the number of Canadian tradespeople aged 15 to 24 fell by 12.2 percent, a drop of more than 31,000 young workers.
Neither figure predicts how long a specific Vaughan restaurant will wait for a plumber. Together, they describe a labour pool with less capacity to move crews forward when a project needs to catch up.
Projected retirements set against the shrinking pool of young tradespeople.
Restaurant and Food-Hall Projects Face the Sharpest Dependencies
Commercial Kitchens Have Interlocking Building Systems
A clothing store needs lighting and finishes. A commercial kitchen needs higher-capacity electrical service, grease-rated exhaust, drainage, refrigeration lines, and gas connections governed by provincial safety requirements. More systems create more points where a missing crew can stop everything downstream.
When one of those trades is unavailable, the consequences often land in a predictable order:
Equipment commissioning moves to a later date.
Inspections and corrective work shift with it.
Operators must reschedule staff training, inventory delivery, and opening promotions.
Rent and carrying costs may begin before revenue does.
Gas-Fired Equipment Creates a Specialized Labour Constraint
Gas ranges and fryers cannot be connected by whoever happens to be on site that week. Under Ontario Regulation 215/01: Fuel Industry Certificates, anyone doing regulated work on fuel-burning appliances needs the applicable certificate or must be authorized under the regulation.
HVAC training and gas certification overlap in the labour market, but they are not the same credential and do not cover the same scope. If you are weighing Skilled Trades College gas technician training against other options, check that a program delivers introductory HVAC instruction, or a documented pathway toward a regulated certificate. Those are two very different forms of training.
Opening-Date Risk Extends Beyond the Contractor
A late fit-out does not stay inside the construction contract. Lease commencement clauses can start rent before a store begins trading. Equipment warranties may begin at delivery, not commissioning, and a franchisor can lose the launch window around which a marketing plan was built.
Delay risk varies by project, system, and contractor availability, so a single average for GTA retail projects would not reliably predict an individual opening. Perishable inventory orders and staff onboarding dates still hinge on physical milestones such as completing and balancing the kitchen ventilation system.
The Labour Gap Runs Deeper Than Any Training Program
Vaughan’s Construction Sector Shows Where the Pressure Concentrates
Vaughan is a useful place to watch this play out, because construction is a measurable part of the local economy. The City of Vaughan puts the sector’s 2023 output at $4 billion in real GDP.
The City of Vaughan puts the sector’s 2023 output at $4 billion in real GDP.
That scale creates both opportunity and competition. A deep contractor market means more firms may be capable of taking on a fit-out, but a restaurant project can still sit in a queue behind residential towers and industrial developments that book labour further in advance.
Construction Retirements Will Keep Pressuring Capacity
A 2023 BuildForce Canada report summarized by Statistics Canada projects that more than 245,000 construction workers will retire by 2032, leaving a potential shortfall of more than 61,000 workers.
Schools can add entrants at the beginning of that pipeline. Whether those entrants become productive journeypersons hinges on employers willing to sponsor apprentices, the availability of supervised hours on job sites, and the capacity of the certification system.
Ontario’s Building Targets Intensify Competition for Labour
Ontario has set a target of building at least 1.5 million homes by 2031. Meeting housing and infrastructure demand will require additional skilled workers over the coming decade.
Ontario has set a target of building at least 1.5 million homes by 2031.
Those workers are not reserved for retail construction. Commercial tenants recruit from a labour market already serving housing and major infrastructure, so a food-hall fit-out in Vaughan may compete with larger projects for the same certified tradespeople.
Treat Trade Availability as a Planning Variable
You cannot fix the labour supply for an individual project, but you can change how you plan around it. Bring the general contractor into the process during site selection and ask which specialty trades are already booked in that area before anyone commits to a public opening date.
Put out the date once the construction schedule looks credible, not sooner.
The contractor’s schedule should lay trade dependencies against inspection dates. Go over that document before any opening announcement goes public.
Skilled Trades College of Canada Questions for GTA Employers and Future Apprentices
What Counts as a Skilled Trade in Canada?
A skilled trade is an occupation built on specialized technical knowledge and hands-on ability. Most people build those skills through a mix of classroom time, apprenticeship, and supervised work on the job. Retail construction draws on electricians, plumbers, refrigeration and air-conditioning mechanics, sheet-metal workers, and gas technicians. Regulation and certification requirements differ by province and occupation.
Which Skilled Trades Are Most in Demand Right Now?
Evaluate demand locally, since the schedule-critical trade changes by project and by year. In GTA retail construction, electrical and plumbing work often becomes schedule-critical early. On commercial kitchen projects, refrigeration and gas qualifications carry just as much weight. Retirement projections at the national level point to strain across a wide range of construction trades.
What Is the Best Skilled Trade to Enter in Canada?
The right pick comes from local employment demand, training requirements, working conditions, and the kind of work a student hopes to do. Across the GTA, electrical, plumbing, HVAC, and gas-related occupations feed into busy construction and building-maintenance markets. Prospective students should compare the route from introductory training to apprenticeship and certification before choosing a program.
Which Ontario College Is Best for Skilled Trades?
No institution is objectively best for every student. Look at curriculum, lab hours, and instructor experience. Then weigh total cost, location, and how clearly each program documents its route into apprenticeship or certification. If Skilled Trades College Vaughan campus programs are on your shortlist, look at Skilled Trades College electrician training in Vaughan and Skilled Trades College plumbing training in the GTA alongside those broader factors. A number of Ontario colleges run focused pre-apprenticeship programs in Vaughan and across the wider GTA, geared to students who want foundational, hands-on training.
Which Skilled Trade Is Quickest to Learn?
Picking the fastest trade to learn is tricky, because introductory training and occupational qualification run on separate clocks. Introductory education and occupational qualification are different milestones. A short pre-apprenticeship course can build foundational skills in weeks or months; one common HVAC program format runs 12 weeks. Full qualification takes much longer; apprenticeship hours, examinations, and certification can all come into play.
How Long Does It Take to Become Qualified in a Trade?
Introductory programs can run anywhere from a few weeks to a few months. Full apprenticeship and certification pathways often stretch over years. Your own timeline will shift with the trade, provincial requirements, accumulated work hours, examination completion, and finding an employer or sponsor willing to take you on.
Retail Growth Depends on the People Who Build the Space
Leases get signed on the strength of demand forecasts. Stores open on the strength of tradespeople who can turn empty square footage into a functioning restaurant. Workforce development is therefore a commercial-capacity issue for the GTA. Training institutions can prepare new entrants, while employers and regulators determine how quickly those entrants become qualified.
The practical move for retailers is straightforward: identify a project’s trade dependencies before approving an opening schedule. That will give you a more realistic view of when tradespeople can complete and commission the ventilation, electrical systems, and kitchen equipment.
Canadian retail activity strengthened in June, with purchasing volumes rising faster than headline sales and several major categories ending the second quarter with improving momentum. This August 2026 edition of the Canadian Retail Monitor reviews the latest retail-related data released in August, which primarily covers June because Statistics Canada publishes these figures on a delayed schedule.
Retail sales reached $74.3 billion in June, up 0.6% from May and 5.2% from a year earlier, according to Statistics Canada. More significantly for underlying consumer demand, retail sales volumes increased 1.5% from May and 2.1% year over year.
The results show a market that remains highly uneven. Health and personal care, apparel and general merchandise generated substantial real growth, while food retail continued to weaken. Higher gasoline prices contributed heavily to the increase in headline retail dollars even as fuel volumes declined.
Retail Insider’s analysis of the April-to-June period also shows momentum improving in several discretionary categories as the second quarter progressed.
*Core retail excludes gasoline and fuel vendors and motor vehicle and parts dealers.
June capped a stronger second quarter. Retail sales increased 2.2% in Q2, while sales volumes rose 0.4%.
Real Retail Demand Strengthens
The gap between dollar sales and volumes is one of the most important signals in the June data.
Retail sales increased 0.6% from May, but volumes rose a much stronger 1.5%. That indicates the monthly improvement reflected greater purchasing activity rather than simply higher prices.
The year-over-year comparison is more mixed. Retail sales were 5.2% higher than in June 2025 while volumes increased 2.1%, leaving part of the headline growth attributable to prices.
Gasoline provides the clearest example. Sales at gasoline and fuel vendors were up 20.2% from a year earlier, while volumes fell 6.6%. Gasoline prices rose by a similar magnitude over the period.
The distinction matters commercially. Rising sales dollars do not necessarily indicate strengthening demand when prices are moving sharply higher.
What Drove Canada’s Retail Growth?
Canadian retail sales increased by approximately $3.7 billion between June 2025 and June 2026, with a relatively small number of categories accounting for much of the increase.
Retail category
Approx. contribution to YoY retail growth
Gasoline and fuel
+1.76 percentage points
General merchandise
+1.39 pts
Health and personal care
+1.13 pts
Motor vehicles and parts
+1.00 pt
Sporting, hobby and miscellaneous
+0.42 pts
Clothing-related retail
+0.30 pts
Building materials and garden
-0.22 pts
Food and beverage
-0.25 pts
Furniture, home furnishings and electronics
-0.29 pts
Gasoline accounted for a large share of nominal retail growth, but that contribution was overwhelmingly price-driven.
The picture changes considerably when volumes are examined. General merchandise and health and personal care were the largest contributors to real Canadian retail growth, while food and beverage retail and gasoline were the biggest drags.
That makes the underlying June story stronger than the headline sales figure alone suggests.
Retail Sector Pulse
Retail Insider maps Statistics Canada data to its own sector classifications to provide a consistent framework for the monthly Monitor and upcoming sector reports.
The RI classifications are analytical categories rather than official Statistics Canada definitions. Broader Statistics Canada industries are used as proxies where necessary.
Retail Insider Sector
June Signal
Key Evidence
Health & Beauty
Strong
Health/personal care sales +13.5%; volume +12.7%
Apparel & Fashion
Improving
Clothing-related sales +5.4%; volume +6.6%
Department Stores & General Merchandise
Accelerating
Sales +9.6%; volume +10.0%
Grocery
Contracting
Food/beverage -1.3%; supermarket volume -4.5%
Home Furnishings
Stabilizing
Annual weakness continues, but recent sequential trend improved
The signals are intended to identify direction rather than mechanically rank sectors. The classifications can become more precise as additional monthly observations accumulate.
Health & Beauty Maintains Strong Momentum
Health and personal care remained one of the strongest areas of Canadian retail in June.
Sales increased 13.5% year over year, while volumes rose 12.7%. Average sales during April through June were approximately 3.5% higher than during January through March, with real volumes also strengthening.
The relatively small difference between sales and volume growth indicates that the increase was primarily demand-driven rather than inflation-driven.
Broader retailer reporting provides some supporting context. Target said wellness-related categories generated double-digit first-quarter growth after it expanded the assortment, although its predominantly U.S. results are contextual rather than a proxy for Canadian performance.
The Canadian evidence itself is strong enough to classify Health & Beauty as one of the country’s leading retail sectors entering the second half of 2026.
Apparel & Fashion Enters Summer With Improving Demand
Canadian apparel-related retail strengthened as the second quarter progressed.
Sales at clothing, clothing accessories, shoes, jewellery, luggage and leather goods retailers increased 5.4% from June 2025, while volumes were 6.6% higher. Average current-dollar sales during April through June were approximately 2.7% above the January-to-March average.
Retailer results during the period point in the same general direction. Gap Inc. reported a 2% company-wide comparable-sales increase in its latest quarter, including a 10% increase at Gap, 2% at Banana Republic and 1% at Old Navy. Management identified strength in areas including denim and activewear, while Athleta and some seasonal categories remained weaker.
Canada Goose also reported apparel leading growth in its latest completed fiscal quarter as it expanded its seasonal product offering, although that reporting period largely preceded June.
The evidence supports an Improving assessment rather than a uniformly strong one. Performance remains uneven by retailer and product category, but Canadian apparel entered summer with stronger real demand than earlier in the year.
Department Stores & General Merchandise Accelerates
General merchandise was one of June’s standout categories.
Sales increased 2.7% from May and 9.6% from a year earlier, while volumes rose 10.0% year over year. The close relationship between nominal and real growth indicates that the increase was overwhelmingly driven by purchasing activity.
The monthly strength came after a comparatively subdued earlier part of the quarter, making June look more like a late-Q2 acceleration than a continuation of uniformly strong growth.
Canadian retailer evidence also points to strength in value-oriented formats. Dollarama reported 5.6% Canadian same-store sales growth in its latest quarter, supported by both traffic and basket growth. Management said affordability and everyday value remained important to consumers.
Dollarama’s results cannot explain the Statistics Canada increase directly, but they provide evidence that the country’s Discount and Value segments were seeing strong consumer engagement during the broader period.
Grocery Remains Under Pressure
Food retail was one of the weakest parts of the Canadian retail market in June.
Food and beverage retailer sales declined 1.3% from a year earlier, while volumes fell 4.5%. Supermarkets and other grocery retailers excluding convenience stores recorded sales down 1.1% and volumes down 4.5%.
The weakness extends beyond a single month. Average food and beverage retail sales during April through June were approximately 1.3% below the January-to-March average, while real volumes were roughly 1.8% lower.
Food purchased from stores was also 3.9% more expensive than a year earlier. Canadians therefore spent slightly less at supermarkets despite higher prices, while the quantity purchased fell much more sharply.
Individual grocers are not necessarily following the national aggregate.
Empire Company reported food sales growth of 2.1% and same-store sales growth of 1.4% in its latest fiscal quarter. Management emphasized promotions, own brands, value-sized products and discount formats while noting continued pressure on household budgets.
Loblaw has similarly pointed to traffic and market-share gains supported by value positioning, particularly through hard-discount banners.
The contrast is commercially significant. Industry-wide grocery volumes can decline while individual retailers grow through market-share gains, store expansion, format mix and stronger execution.
Canada’s grocery environment therefore looks like weak aggregate volume demand combined with continuing competitive share shifts.
Home Retail Remains Weak, With Signs of Stabilization
Home-related retail remained below year-earlier levels in June.
Sales at furniture, home furnishings, electronics and appliance retailers declined 5.6% year over year, while volumes fell 4.2%. Electronics and appliances were particularly weak, with sales down 11.1% and volumes down 9.9%.
Furniture performed considerably better. Current-dollar sales were approximately flat year over year while volumes increased 2.8%.
Recent sequential data also suggest the broader category may be stabilizing. Average second-quarter real volumes for furniture, home furnishings, electronics and appliances were approximately 1.6% above the first-quarter average, even though current-dollar sales were essentially unchanged.
Company performance shows how much conditions differ within the sector. Williams-Sonoma reported a 4.8% comparable-sales increase in its latest quarter, with every major brand positive. Management said it gained market share while the broader home furnishings market declined in the low single digits and identified Canada among its stronger international markets.
Best Buy reported a different pattern. Overall comparable sales increased 2%, supported by computing, gaming, mobile phones and newer technology categories, while appliances remained pressured. Management linked appliance weakness partly to the stagnant housing market and a highly competitive retail environment.
The evidence points to a weak aggregate market with substantial differences between categories and retailers. Retail Insider therefore assesses Home Furnishings as Stabilizing and Electronics & Appliances as Weak.
Canadian Retail Momentum
The Sector Pulse describes where categories stand today. The momentum measure answers a different question: is their direction improving or deteriorating?
Retail Insider compares the average seasonally adjusted sales level during April through June with the preceding January-to-March period.
Category
3-Month Sales Momentum
June YoY Sales
June YoY Volume
RI Assessment
Health & personal care
+3.5%
+13.5%
+12.7%
Strong
Clothing-related
+2.7%
+5.4%
+6.6%
Improving
Motor vehicles & parts
+2.6%
+3.7%
+3.2%
Positive
Total retail
+2.2%
+5.2%
+2.1%
Improving
Building materials & garden
+1.2%
-3.7%
-5.8%
Tentative improvement
Sporting/hobby/miscellaneous
+0.7%
+7.1%
+5.7%
Positive
General merchandise
+0.4%
+9.6%
+10.0%
Accelerating late in Q2
Furniture/home/electronics
~0.0%
-5.6%
-4.2%
Stabilizing
Food & beverage
-1.3%
-1.3%
-4.5%
Contracting
Gasoline & fuel
+12.0%
+20.2%
-6.6%
Price-driven
Health and personal care shows sustained strength, while apparel improved through Q2. General merchandise’s modest three-month figure masks a much stronger finish in June.
Home retail remains weak against last year but is showing less sequential deterioration. Food retail remains the clearest area of persistent weakness.
Gasoline again demonstrates why dollar growth must be separated from demand. Average gasoline and fuel sales increased sharply between the first and second quarters while real volumes declined.
Market Segment Signals
Statistics Canada does not separate retail activity into Luxury, Premium, Mid-Market, Value, Discount or Off-Price segments. Company reporting can provide supporting signals where Canadian evidence is strong enough.
The clearest signal this month is Value and Discount.
Dollarama’s 5.6% Canadian same-store sales increase was supported by both traffic and basket growth. Empire continues to expand discount-oriented formats, while Loblaw has highlighted hard discount as an important source of traffic and market-share growth.
The evidence does not establish that Canadian consumers are universally trading down. It does show that value positioning remains commercially important across several large retail businesses.
Toronto Pulls Ahead of Vancouver
Geographic performance diverged considerably in June.
Market
June Sales
MoM
YoY
Canada
$74.3B
+0.6%
+5.2%
Toronto
$13.0B
+3.9%
+6.6%
Montréal
$7.85B
+1.0%
+4.1%
Vancouver
$5.01B
-0.1%
-0.2%
Toronto was the standout major metropolitan market, with sales increasing 3.9% from May and 6.6% from a year earlier. The result marked a sharp acceleration after a more uneven spring.
Montréal recorded moderate growth, with sales increasing 1.0% from May and 4.1% year over year.
Vancouver was considerably weaker. Sales edged down 0.1% from May and were 0.2% below June 2025 levels. Following a strong May increase, the result points to continued volatility rather than a steady downward trajectory.
Atlantic Canada Posts Strong Annual Growth
Several smaller markets recorded faster year-over-year growth than Canada’s largest provinces.
Geography
MoM
YoY
Newfoundland and Labrador
+1.2%
+6.9%
Prince Edward Island
+1.3%
+10.6%
Nova Scotia
+0.9%
+8.0%
New Brunswick
-0.7%
+4.2%
Quebec
+0.5%
+4.5%
Ontario
+1.6%
+5.9%
Manitoba
+0.7%
+7.2%
Saskatchewan
-0.3%
+3.8%
Alberta
-1.3%
+7.4%
British Columbia
+0.1%
+1.7%
Yukon
-2.8%
+7.7%
Northwest Territories
-0.4%
-4.4%
Nunavut
+1.5%
+18.4%
Prince Edward Island, Nova Scotia, Alberta and Manitoba all posted relatively strong annual growth, although smaller population bases can produce greater volatility.
Ontario also outperformed the national growth rate, helped by Toronto’s strong June. British Columbia remained one of the weaker large provincial markets.
Channel Monitor: E-Commerce Rebounds Sharply
Canadian retail e-commerce sales increased 9.9% from May to $5.73 billion in June.
Online sales represented 7.7% of total retail trade, compared with a revised 7.1% share in May. E-commerce sales were 18.7% higher than a year earlier.
The June increase is notable, but one month is insufficient to determine whether Canadian retail has entered a new phase of digital share growth.
Historical e-commerce estimates can also be revised materially. Statistics Canada revised May e-commerce sales upward in its subsequent release, reinforcing the importance of using the latest available series.
For now, June is best viewed as a notable e-commerce rebound that warrants monitoring rather than evidence of a structural step-change.
Restaurant Spending Outpaces Food Retail
Canadian spending at restaurants and other foodservice businesses continued to outperform grocery retail in June.
Seasonally adjusted foodservice and drinking-place sales reached approximately $8.85 billion, up 0.5% from May and 6.0% from a year earlier. Full-service restaurant sales increased 6.7% year over year, while limited-service sales rose 6.1%.
Restaurant prices increased 2.7% over the same period, below the rate of foodservice sales growth.
At supermarkets, the pattern was very different. Sales declined 1.1% year over year and volumes fell 4.5%, while food purchased from stores was 3.9% more expensive.
June also coincided with FIFA World Cup activity in Toronto and Vancouver. Statistics Canada specifically referenced the tournament when discussing June conditions, making it relevant contextual evidence for the month. Drinking-place sales increased 2.7% from May to their highest level since January 2023.
The comparison does not establish that consumers directly shifted spending from grocery stores to restaurants. It does show that restaurant spending substantially outperformed grocery retail during June.
What Canadians Were Buying
Statistics Canada’s Retail Commodity Survey provides another view of consumer spending by tracking products sold rather than the industries selling them.
The latest available commodity figures cover May and are not seasonally adjusted, so they are best used as supporting evidence rather than compared directly with June retail-industry data.
Total retail commodity sales reached $79.9 billion in May, up 4.0% from a year earlier. Home health products increased 11.2%, sporting and leisure products rose 6.0%, infant care, personal and beauty products increased 4.2%, and food and beverages were up 3.1%.
Home furniture, furnishings, housewares, appliances and electronics declined 2.5%. Footwear fell 0.6%, hardware, tools, renovation and lawn-and-garden products declined 2.4%, and audio, video and game software sales were down 22.0%.
The commodity figures broadly reinforce the wider Monitor: health-related spending remains strong, sporting and leisure demand is positive, while several housing-related categories continue to face pressure.
Inflation Adds Context to Retail Performance
Canada’s all-items Consumer Price Index (CPI) increased 2.8% year over year in June, easing from 3.2% in May.
Consumer Price Index category
June YoY
All items
+2.8%
Food
+3.5%
Food purchased from stores
+3.9%
Clothing & footwear
+1.5%
Household operations/furnishings/equipment
-0.2%
Health & personal care
+2.5%
Gasoline
+20.5%
Goods overall
+3.5%
Services
+2.2%
CPI categories and retail-industry categories cover different baskets and are not directly equivalent. They are nevertheless useful for determining whether sales growth appears primarily demand-driven or price-driven.
Health and personal care provides one of the clearest examples of real growth. Retail sales increased 13.5% and volumes 12.7%.
Gasoline presents the opposite case. Spending increased 20.2% while volumes declined 6.6%, alongside a 20.5% increase in gasoline prices.
What to Watch in July
Statistics Canada’s advance estimate suggests retail sales declined approximately 0.8% in July.
The estimate is preliminary and based on responses representing 56.5% of companies surveyed, well below the response rate for finalized monthly retail data. It should therefore be treated as directional.
The July results will help determine whether June’s late-quarter acceleration in general merchandise persisted, whether apparel maintained its improving momentum, whether Home Furnishings continued to stabilize and whether grocery volumes remained under pressure.
They will also show whether June’s sharp e-commerce rebound carried into the summer or proved temporary.
Retail Insider Takeaway
June ended the second quarter on a relatively encouraging note for Canadian retail.
Headline sales increased, but the stronger signal was the 1.5% monthly rise in sales volumes. General merchandise and health and personal care were the largest drivers of real retail growth, while apparel entered summer with improving momentum.
The market remains divided. Food retail volumes continued to contract, Electronics & Appliances remained weak, and gasoline generated substantial sales-dollar growth without corresponding demand growth.
Retailer evidence also shows why aggregate statistics require additional interpretation. Canadian grocers can gain share while overall grocery volumes fall. Selected home retailers can grow in a contracting market. Discount operators can attract stronger traffic even while consumers remain cautious about household spending.
For Retail Insider’s sector outlook, Health & Beauty remains Strong, Apparel & Fashion is Improving, Department Stores & General Merchandise accelerated into the end of Q2, Grocery remains under volume pressure, Home Furnishings shows tentative stabilization, and Electronics & Appliances remains challenged.
The preliminary July estimate suggests Canada’s retail environment remained uneven entering the second half of 2026.
High quality shopping bags from Gather Packaging/Luv2Pak
A Toronto packaging manufacturer compressed nearly three months of production into three weeks this summer as it raced to move Canadian-made shopping bags across the U.S. border before a new 50 per cent tariff threatened its largest market.
Gather Packaging, the Canadian manufacturing operation associated with longtime retail packaging supplier Progress Luv2Pak, shifted its Toronto-area factory into around-the-clock production after learning its paper shopping bags would be caught by the new U.S. tariff measures. The company contacted customers, brought in additional workers and accelerated orders already scheduled for the upcoming holiday season.
Its plant, which historically operated roughly 12-hour shifts five days a week, began running 24 hours a day, six or seven days a week.
“We ran about two and a half, three months worth of production in the span of three weeks,” said Ben Hertzman, whose family owns the business.
Gather managed to move affected U.S. customer shipments across the border by August 14. The production sprint was especially important given the company’s exposure to the American market: Hertzman told Retail Insider that more than 75 per cent of the plant’s production volume had been going to the United States.
The company now has to determine how much of that business can continue if the tariffs remain, and whether additional Canadian orders can help fill the resulting production capacity.
Ben Hertzman, President of Progress Luv2Pak and Gather Packaging
U.S. Market Drives Majority of Production
Gather built its Canadian factory several years ago to manufacture premium paper shopping bags domestically. As the operation grew, the United States became its largest market.
Hertzman said Canadian-made bags had been able to enter the U.S. duty- and tariff-free under USMCA. That helped Gather develop business with major retailers including Abercrombie & Fitch, Victoria’s Secret and Bath & Body Works.
Those companies have stores in Canada, but their much larger U.S. networks meant significant packaging requirements south of the border. Gather already had substantial holiday orders committed when it learned of the tariff threat, prompting the rush to accelerate production.
Hertzman said the 50 per cent tariff fundamentally changes the economics of selling the Canadian product into the United States.
“A Canadian product that falls on that list [is] really unsellable in the United States,” he said. “That fifty percent is just a price increase that they can’t accept.”
Future U.S. Orders Are the Bigger Concern
Gather has not suddenly lost three-quarters of its business. Customers are honouring existing commitments, and Hertzman said the company has a backlog extending at least several months.
The uncertainty comes when retailers begin placing subsequent quarterly and seasonal orders. American customers have told Gather that continuing the relationship becomes difficult if the tariff remains in place.
“If this doesn’t go away, it’ll be difficult for them to place the next order,” Hertzman said.
He said retailers may have longstanding relationships with Gather and want to continue buying from the company, but a 50 per cent tariff becomes difficult to justify when packaging can be sourced from other markets at a lower landed cost.
Because Gather pushed so much U.S.-bound product through its factory ahead of the tariff, it now has material on hand and available capacity that would otherwise have been occupied later in the year. The company is looking north to put some of that capacity to work.
Printing in the warehouse. Image: Gather Packaging
Gather Looks to Canadian Retailers
Gather has begun approaching Canadian retailers about moving some packaging production to its Toronto operation. Hertzman said the early response has been encouraging, although some retailers already have their holiday packaging committed.
In other cases, discussions are underway about future programs and getting Gather onto supplier lists.
The timing coincides with another significant change in the economics of the Canadian packaging market. Beginning September 8, Canada is set to apply a 50 per cent counter-tariff to U.S.-origin goods classified under tariff item 4819.40.00, covering certain paper sacks and bags.
The measure is part of a wider Canadian response to the latest U.S. trade actions. Paper bags in the same tariff category had previously been included in Canada’s 25 per cent counter-tariffs on U.S. goods introduced in March 2025, meaning the September measure raises the applicable counter-tariff to 50 per cent.
For retailers operating in Canada that source affected paper shopping bags from American factories, the change provides another reason to examine their supply arrangements.
Lee Moore, Director of Sales and Marketing with Progress Luv2Pak and Gather Packaging, said retailers with open orders for U.S.-made paper bags face a particularly immediate decision.
“For anyone who has open orders for U.S.-made paper bags, there is an urgency to replace those bags with a source that won’t have such an extreme tariff,” Moore said.
Gather believes its available Canadian production capacity could capture some of that business.
Hertzman is realistic about the difference in market size. The U.S. has roughly 350 million consumers compared with about 40 million in Canada, and paper bags are bulky enough that freight costs make distant export markets difficult to pursue economically.
If the tariff situation becomes prolonged, he said, the factory will increasingly focus on serving Canada.
“We’ve only scratched the surface on who we can speak to,” Hertzman said.
Retail Packaging Supply Chains Under Scrutiny
Canadian retailers source shopping bags from a mix of domestic and international manufacturers. Hertzman said the market includes retail chains, grocers and quick-service restaurants, each with different packaging requirements.
Many retailers and grocers have moved toward reusable totes, which he said are commonly manufactured in China or Vietnam. Paper bags can come from Canadian, American and other overseas factories.
The trade dispute is adding another variable to decisions that already involve price, transportation costs, lead times, inventory and product specifications.
Gather argues that domestic manufacturing can give retailers greater flexibility. Hertzman said retailers sourcing closer to home can respond more quickly to changes in demand, carry less inventory and make faster adjustments to artwork or seasonal programs.
He pointed to a recent order from a large U.S. retailer that was facing an imminent bag shortage while other supply was still moving through its supply chain. The retailer asked Gather how quickly it could respond.
Gather rearranged its production schedule and began deliveries within approximately one week, Hertzman said. An order of that type would normally take one or two months.
The example illustrates one of the advantages Gather is emphasizing as retailers reconsider where they source operational supplies: the ability to respond quickly when inventory requirements change.
Gather Packaging facility north of Toronto. Image: Gather Packaging
“Made in Canada” Enters the Packaging Conversation
Gather also sees an opportunity in the renewed consumer attention being paid to Canadian-made products.
Hertzman describes a branded shopping bag as a highly visible form of retail marketing. Customers carry bags through malls, along streets and onto public transit after leaving a store, extending the retailer’s branding beyond the point of sale.
Gather is proposing that Canadian retailers take the idea further by identifying their bags as Canadian-made. The company uses Canadian paper and says it sources Canadian boxes, ink and glue wherever possible.
For Hertzman, that creates an opportunity for retailers already emphasizing their Canadian identity to carry the message through to their packaging.
A Long History With Canadian Retail
Progress Luv2Pak has worked with Canadian retailers for decades, including on one of the country’s most recognizable retail packaging programs.
Hertzman and Moore told Retail Insider that the company was involved when Holt Renfrew adopted its now-familiar magenta shopping bags in about 2004. Magenta was selected instead and eventually became closely associated with Holt Renfrew’s visual identity. The story illustrates the role packaging can play in creating a recognizable retail brand.
At Gather’s current operation, bags are engineered for appearance and performance. Hertzman said products undergo testing for weight, handle strength and repeated movement.
One test involves loading a bag with 20 pounds and hanging it for 48 hours. The same loaded bag can then be placed on equipment designed to simulate 3,900 movements associated with someone walking while carrying it.
Hertzman said Gather competes with a small number of Canadian manufacturers as well as higher-end packaging factories in Europe and Asia, particularly for retailers requiring more sophisticated printing and specifications.
Tariffs Test a Canadian Manufacturing Strategy
The current situation creates an unusual challenge for a company that invested in rebuilding domestic production capacity.
Gather successfully established Canadian manufacturing and found substantial demand for its product across the border, with more than three-quarters of its plant volume eventually flowing into the U.S. The tariff has abruptly weakened the economics of that market, while Canada’s response could make domestic production comparatively more attractive to retailers here.
Redirecting exports to another country is difficult. Hertzman said paper bags are bulky products for which transportation represents a meaningful part of the cost, making distant markets such as Europe impractical alternatives for the Toronto factory.
Gather is therefore trying to expand its Canadian customer base while waiting to see whether the trade relationship with the United States improves.
Hertzman said uncertainty is something the company has learned to manage over its long history.
“When there’s challenge and uncertainty, I just focus on what I can control,” he said. “I’m a firm believer that the businesses that succeed in volatile and uncertain times are the ones that are the most nimble, the ones that are the most adaptive, the ones that can react the quickest.”
His family has operated the business for approximately 45 years, while the company itself traces its history back more than a century.
Hertzman pointed to recessions, strikes, COVID-19 and other disruptions the company has encountered over the decades as evidence that its strategy has repeatedly had to change.
“We’re resilient, and we’re adaptable, and we will figure it out,” he said. “Your success is not defined by the problem. It’s how you respond to it.”
That response is increasingly focused on Canada. A Toronto factory that spent several frantic weeks producing bags destined for American retailers now has material, manufacturing capacity and a reason to pursue considerably more business at home.
Whether Canadian retailers move to fill some of that capacity could determine how successfully Gather navigates the next phase of the Canada-U.S. trade dispute.
Villager Puzzles, a bootstrapped, women-founded Canadian puzzle company, is experiencing impressive retail growth. The brand has sold more than 200,000 puzzles since launch and is now available in over 800 retail locations nationwide, recently adding Simons to its retail network across all locations.
Villager Puzzles collaborates with Canadian women artists, who receive uncapped royalties from every puzzle sold. Some artists have earned between $10,000 and $28,000 over the past year.
Founder & CEO Kelly Strimer, who describes herself as a “Puzzle Snob,” spoke to Retail Insider about the retail concept.
Question: What has driven Villager Puzzles’ growth from its launch to more than 800 retail locations across Canada, and what does the addition of Simons mean for the company?
Answer: The idea for Villager Puzzles started with my love of puzzles. I found them to be such a great way to relax, but I never really loved the artwork. I saw an opportunity to bring beautiful artwork from Canadian women artists and create puzzles people would be proud to give as a gift, display on their coffee table and, of course, put together.
From the beginning, we’ve focused on three things: great art, strong storytelling and a really high-quality puzzle. Every puzzle introduces customers to an artist. That artist connection has become a big part of what makes Villager different.
When I launched the company, I didn’t have a marketing budget, so I turned to social media to get feedback, share the journey and connect with people who believed in what we were building. That’s where I found our “village” — puzzle lovers, artists and independent retailers — and that community has been one of the biggest drivers of our growth.
Kelly Strimer Villager Puzzles photo
It also shaped our retail strategy. We’ve intentionally built relationships with specialty Canadian retailers that share our values around supporting women artists, Canadian businesses and shopping local. That focus has helped us grow to more than 800 retail locations across Canada.
Having Simons join that community is an exciting milestone. They have a strong Canadian identity and a reputation for discovering interesting brands, so it feels like a natural extension of the strategy we’ve built from the beginning. It’s also a meaningful endorsement of what we’ve created and an opportunity to introduce Villager and our artists to an even broader Canadian audience.
Q: How has the company’s bootstrapped, women-founded model influenced the way you have approached growth, product development and retail expansion?
A: I think being bootstrapped and women-founded has shaped Villager pretty fundamentally. We’ve had to be very financially disciplined because every dollar we spend comes from the business itself. Everything we’ve built has been funded by sales and reinvested back into the company, and I’m really proud of that. When we appeared on Dragons’ Den, I know a lot of people assumed we accepted the deal, but behind the scenes, we decided to go it alone. No Dragon required—yet!
Villager is also a community brand, and one of our core values is shared success. That’s especially evident in how we work with our artists. We pay royalties on every puzzle sold because if an artist’s work succeeds as a puzzle, we believe she should share in that success. Honestly, one of my favourite days every quarter is royalty day. I love seeing those numbers and knowing we’re helping artists grow their own businesses.
Being women-founded has also influenced how we build relationships—with artists, retailers and customers. We’re collaborative and relationship-driven. We want our retailers to feel like partners, our artists to feel supported, and our customers to feel part of something bigger than simply buying a puzzle.
For me, growth isn’t about growing as quickly as possible. It’s about building something that lasts: a profitable, financially healthy company that continues creating opportunities for the people in our community. That’s what success looks like to me.
Kelly Strimer on Dragons’ Den
Q: What are you seeing in terms of consumer demand for puzzles and other leisure products, and who is the Villager Puzzles customer today?
A: I think we’re seeing an interesting shift in the way people are thinking about leisure time. There’s a growing appetite for activities that allow us to step away from screens and actually be present—whether that’s through puzzles, crafts, reading, gardening or other hobbies. There’s something appealing about doing something with your hands and having a tangible sense of accomplishment at the end of it.
Puzzles sit at this intersection of mindfulness, creativity, wellness and connection. You can do one on your own as a way to unwind, but you can also bring one out when friends or family are visiting, or give it as a gift. And I think there’s also a bit of nostalgia involved. People remember doing puzzles growing up, but today’s puzzle customer is looking for something that feels much more design-forward and reflective of who they are.
That’s really where Villager fits. Our customer is someone who cares about beautiful things and loves the story behind what they’re buying. They’re drawn to the artwork, but they also care about the quality of the puzzle and the experience of completing it. And because our puzzles feature artwork from Canadian women artists, there’s an added opportunity for customers to discover and support an artist while they’re enjoying the puzzle.
What I love most is that there really isn’t one “puzzle person.” Our customers span generations and life stages. We have people buying puzzles for quiet evenings at home, families doing them together, friends bringing them on vacation, and people looking for a thoughtful gift. There’s also a real desire to support Canadian and women-owned businesses, so I think our customers are often buying into the story and values behind Villager as much as they’re buying the puzzle itself.
Q: How does the royalty model for the women artists you work with function, and what impact have earnings of $10,000 to $28,000 had on the artists and the company’s ability to attract new creators?
A: Our royalty model is pretty simple: our artists receive an uncapped royalty on the selling price of every puzzle featuring their artwork. So as a puzzle sells, the artist directly participates in that success — there’s no cap on what they can earn.
That’s something that was really important to me when I started Villager Puzzles. I didn’t want the artists to simply be paid a one-time fee for their artwork and then watch someone else benefit from its success.
I remember at the end of last year, I wrote a $10,000 quarterly royalty cheque to one of our artists for the first time. She had just had a baby, and knowing that this income was arriving at such an important moment in her life was incredibly meaningful to me. It really brought home what this model can mean — not just as an extra cheque, but as recurring income that can make a tangible difference in an artist’s life.
Q: With more than 200,000 puzzles sold and a presence in more than 800 stores, what are your growth plans for Villager Puzzles over the next few years?
A: I think the next stage of growth for Villager is going to be thoughtful expansion — continuing to build on the things that have gotten us here: incredible Canadian women artists, high-quality products, great storytelling and a strong specialty retail community.
We’ll continue bringing more artists into the Villager community and expanding our holiday collection, but we’re also starting to explore new puzzle formats and products. This year, for example, we’re launching an advent calendar for the first time. Longer term, I see an opportunity to take the relationships we’ve built with artists and our customers and expand into other creative hobbies — things like paint-by-number or craft kits.
A big part of how we’ll make those decisions is by listening to our “village.” We want our community to have a voice in what we create — whether that’s the art, the artists we work with, the puzzles themselves or what products we explore next. If we’re going to grow, I want us to grow alongside the people who have helped build this company.
Photo: Francis Hamel photographer | iDA Productions
BRP Inc. raised its full-year earnings guidance Thursday after reporting an 18.5 per cent increase in second-quarter revenue, although tariffs and a supplier financial restructuring contributed to a sharp decline in profit margins.
The Quebec-based powersports company reported revenue of $2.24 billion for the three months ended July 31, up from $1.89 billion a year earlier. The increase was primarily driven by higher off-road vehicle shipments and a favourable side-by-side vehicle product mix.
BRP reported a net loss of $136.8 million, compared with net income of $57.1 million in the same quarter last year. Normalized EBITDA fell 34.9 per cent to $138.8 million from $213.2 million.
The company said gross profit declined by $135.2 million, or 34 per cent, to $262.5 million, while its gross profit margin fell to 11.7 per cent from 21.1 per cent.
BRP attributed the decline primarily to the impact of Section 232 tariffs on steel, aluminum and copper imports into the United States, as well as the effects of a supplier financial restructuring. The restructuring had an unfavourable impact of $74.8 million, or 330 basis points, on gross profit and gross profit margin.
The impact was partially offset by higher volumes and lower sales programs, mainly in off-road vehicles.
Denis Le VotPhoto: Francis Hamel photographer | iDA Productions
“Our second-quarter financial results exceeded expectations, reflecting disciplined execution and increased ORV shipments to support sustained retail momentum. Given our strong performance in ORV leading to additional market share gains, and reduced net tariff costs, we are raising our full-year guidance,” said Denis Le Vot, president and CEO of BRP.
The company increased its fiscal 2027 guidance for normalized diluted earnings per share to between $4 and $4.50, from $3.75 to $4.25 previously. BRP is also forecasting total revenue of between $9.225 billion and $9.475 billion, compared with $8.443 billion in fiscal 2026.
The revised guidance calls for normalized EBITDA of between $1.025 billion and $1.075 billion, compared with $1.103 billion in fiscal 2026. BRP expects net income of between $160 million and $195 million, down from $340.4 million last fiscal year.
The company said its North American retail sales increased one per cent during the quarter. Growth was driven by industry trends in side-by-side vehicles and market-share gains in off-road vehicles, partially offset by lower sales of seasonal products.
Revenue from year-round products increased 33.3 per cent to $1.49 billion, while seasonal-product revenue declined 8.9 per cent to $427.7 million. Revenue from parts, accessories, apparel, OEM engines and other activities rose 6.3 per cent to $324 million.
For the six months ended July 31, BRP reported revenue of $4.63 billion, an increase of 23.9 per cent from $3.74 billion a year earlier. Normalized EBITDA increased 14.3 per cent to $473.2 million.
The company reported a six-month net loss of $9.5 million, compared with net income of $218.1 million in the same period last year. Normalized net income, however, increased 19.7 per cent to $121.5 million.
BRP generated $686.8 million in operating cash flow during the first six months of the fiscal year, compared with $373.1 million a year earlier. It said the increase was mainly due to favourable changes in working capital and lower income taxes paid, partially offset by lower profitability.
Photo: Francis Hamel photographer | iDA Productions
The company invested $126.2 million in capital expenditures during the period, including spending on new products and modernization of its software infrastructure. It also returned $231.7 million to shareholders through quarterly dividends and share repurchases.
BRP’s board declared a quarterly dividend of 25 cents per share on Sept. 2. The dividend is scheduled to be paid Oct. 13 to shareholders of record at the close of business Sept. 29.
The company said it expects normalized diluted earnings per share in its third quarter to decline by approximately 50 per cent to 60 per cent compared with the same quarter of fiscal 2026, mainly because of increased tariff impacts.
BRP also outlined plans to release major off-road product announcements every six months over the next four years. The company recently introduced several new products and launched BRP Financial Services, a branded retail financing program in the United States.
“Looking ahead, we remain focused on navigating through the volatile geopolitical and trade environment and advancing our long-term growth prospects. Our recent Club BRP dealer event allowed us to showcase innovative initiatives that strengthen our competitive position, including a commitment to releasing major off-road product news every six months for the next four years. This will be instrumental in achieving our goal of making Can-Am the number one ORV brand in North America and being the undeniable OEM of choice for dealers and riders,” said Le Vot.
With the recent opening of its first U.S. location in Dallas, Texas, Canadian dessert café brand D Spot Dessert Café has officially begun its international expansion strategy.
Founded in Canada in 2014, D Spot has grown to more than 55 locations nationwide and recently launched its first American location, marking a significant milestone for the brand.
Additional expansion is planned across key U.S. markets, including Houston, Chicago, Nashville and Atlanta.
In an interview with Retail Insider, Kaan Sayiner, CEO and President of D Spot Dessert Café, said the biggest operational and business challenge in the expansion was translating a well-established Canadian operating model into a new country without compromising the consistency of the brand.
“That included building a U.S. supply chain, qualifying alternative products and vendors, staffing and training a new team, and ensuring that our food quality and service standards carried over. We addressed those issues with significant hands-on support from our corporate training and operations teams, tighter operating procedures and direct work with U.S. suppliers. Dallas has also been an important learning market that is helping us make each subsequent U.S. opening more efficient,” he said.
Kaan SayinerD Spot photo
Sayiner said the brand saw Dallas as an ideal market in which to prove the concept in the U.S.
“It offers the scale, diversity and growth characteristics we look for, along with a strong suburban customer base that aligns well with D Spot’s broad appeal. It also gives us the ability to build density in Texas, rather than opening isolated locations across the country. That clustering strategy will ultimately make marketing, training, supply chain and operational support much more efficient,” he added.
How does consumer demand for dessert-focused dining differ between Canada and the U.S., and what have you learned from the Dallas launch so far?
The fundamental consumer demand in Canada and the U.S. is more similar than different, Sayiner said.
“In both markets, people are looking for more than simply dessert; they are looking for an experience, variety and a place they can visit with friends and family across multiple occasions. Dallas has reinforced our belief that the D Spot concept can travel successfully. It has also reminded us that entering a new country requires strong local execution and market development rather than assuming brand awareness will exist from day one,” he explained.
“Franchising will remain the primary engine of our U.S. growth, but our focus is very clearly on quality rather than simply adding franchisees. We are looking for well-capitalized operators who are prepared to be engaged in the business, follow the system, build strong teams and potentially develop multiple locations over time.
“We would rather grow more deliberately with fewer, stronger partners than accelerate with franchisees who are not the right long-term fit. That approach is consistent with our formal franchisee evaluation process, which looks at financial capacity, operating and leadership experience, commitment, system alignment and growth potential.”
D‑Spot Dessert Café photo
Sayiner said the company is deliberately not putting a hard public number on the U.S. opportunity at this stage.
“What is clear to us is that the addressable opportunity in the United States is substantially larger than the remaining whitespace available to us in Canada, and we expect the potential number of new U.S. locations to ultimately exceed the total opportunity for additional locations in Canada,” he said.
“Our priority over the next three to five years is therefore not chasing a store count, but establishing the right markets, building density within them and growing with franchise partners capable of developing those markets properly. Dallas is our starting point, with additional U.S. markets already forming part of our development structure.”